(LinkedIn: https://www.linkedin.com/pulse/mid-transition-series-part-1-electrify-first-expand-grid-marcoux-tqkue/)
The Mid-Transition Series explores how overlapping systems, misaligned expectations, and institutional inertia shape the complex path to a clean energy future.
Electrify First, Expand the Grid and Catch Up on Generation
Before we dive into the messiness, misinterpretations, and institutional frictions of the energy transition, we begin with what is clear and actionable: taking no-regret steps like electrifying what we can, building the grid to support it, and scaling generation to match. The harder-to-electrify sectors — like freight, aviation, and high-temperature industrial heat — can be addressed through focused R&D and long-term planning.
That’s the logic: begin by electrifying what’s ready, and preparing for what’s harder. Here’s how that plays out step by step:
1. Start with efficient electrification of ready sectors. Electrify what we already know works: passenger transport, building heating, and low-temperature industrial processes — while also deploying energy efficiency measures across buildings and industry to reduce demand and system stress. These end uses are technologically mature, economically viable, and provide immediate and measurable improvements in efficiency, emissions, and air quality. Electrifying them now lays the demand-side foundation for broader system transformation.
2. Build out the grid — physically and digitally — in lockstep with new demand. Transmission and distribution systems must be reinforced and extended to accommodate distributed generation, shifting loads, and the increasing need for ancillary services. At the same time, digital tools — such as grid automation, dynamic pricing and real time forecasting — are needed to shape and manage generation and demand more intelligently. These upgrades are not just technical but strategic, making the grid more flexible, responsive, and ready for a clean, electrified future.
3. Expand generation — prioritize clean, but build what’s needed. New capacity must come online fast. After decades of relatively flat electricity demand growth, the entire electricity supply chain — from transformers and turbines to heat pumps and skilled labour — must now scale up dramatically. While clean sources like wind, solar, hydro, geothermal, nuclear, and storage are the goal, interim fossil generation may be needed to ensure reliability and flexibility. CCGT plants, for example, can be built relatively quickly under normal conditions and operate at 55–62% efficiency — although supply chain bottlenecks may temporarily affect delivery timelines. Paired with efficient end-use electrification, they offer a transitional solution that supports decarbonization without locking in long-term end-use emissions. Fortunately, my home province of Québec has ample dispatchable hydropower, easing the integration of additional wind and solar generation, without the need for natural gas plants.
4. Invest now in the hard-to-electrify sectors. Freight, aviation, high-temperature industrial heat — these are more challenging and will require long-term R&D, demonstration projects, and industrial policies to bring viable clean solutions to market.
Conclusion: A successful transition builds the backbone before scaling complexity. Pair efficient end uses with efficient generation. Let the grid evolve with both. And recognize that some technologies will play bridging roles. This is not about perfection today, but about building the systems that allow us to move faster, smarter, and more affordably toward a decarbonized energy future.
The telecom world provides a useful lesson: mobile phone networks didn’t just appear fully formed. They evolved step by step — with spectrum allocation, tower construction, backhaul, device adoption, and billing innovation all occurring in stages. Energy planners should adopt the same mindset: build the backbone first, then enable services and flexibility over time.
Why Fossil Demand May Spike During the Energy Transition (and Why That’s Not Failure
The transition to a low-carbon energy system does not follow a straight, smooth path. During what Emily Grubert and Sara Hastings-Simon call the “mid-transition”, we live with overlapping infrastructures: old fossil-based systems remain active while new clean technologies ramp up.
In this phase, fossil fuel use can temporarily spike — not because we’re failing, but because the old system is still needed to stabilize or supplement the new one. This is particularly true for electricity grids: as electrification surges (EVs, heat pumps, industry), clean generation and storage may not ramp up quickly enough to reliably meet peak demand. In such cases, new fossil-fuel plants may be required as a bridging measure to ensure system adequacy. However, these plants will operate at lower capacity factors over time, as renewable generation, storage, and demand flexibility continue to scale and reduce their role. This dynamic is already visible in China, which has approved and is still building new coal-fired power plants to meet growing demand and to ensure system reliability, especially during peak demand periods or localized shortages. Yet, coal generation is declining in 2025 as renewable generation is increasing. In such cases, the investment in new fossil capacity does not contradict the transition but supports it — by acting as a temporary buffer that becomes less utilized over time. Over the longer term, these same sites can be repurposed. Some plants can be modified to operate as synchronous condensers, providing voltage support and inertia without generating power. Others may be ideal locations for battery storage systems, leveraging existing grid interconnections and permitting. Planning for future reuse at the time of investment can help reduce stranded asset risk and enhance long-term system flexibility.
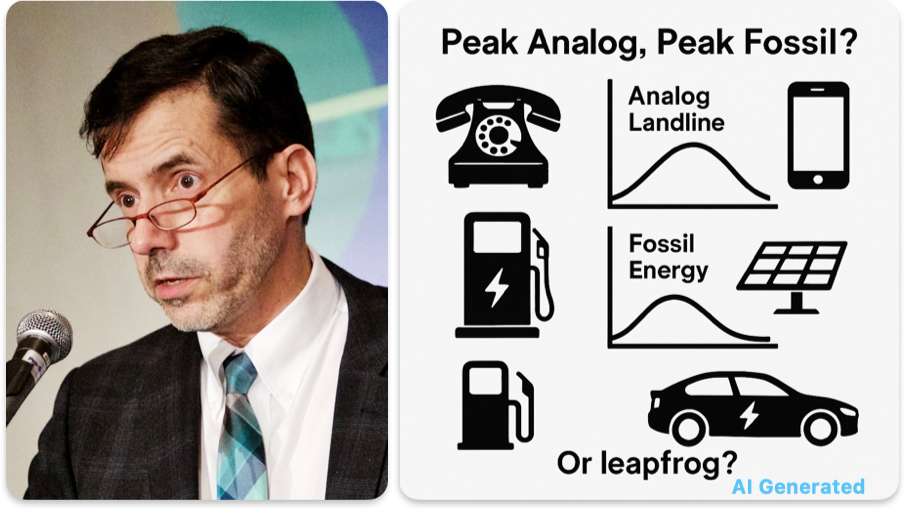
The telecom world followed a similar arc. Landline subscriptions in North America kept growing into the early 2000s, even as mobile phones and Internet telephony took off. At home, I had four analog lines — for the family, a home office, fax, and dial-up Internet — plus an analog cell phone and an analog cable TV service. This setup was typical at the time: peak analog, right before broadband and smartphones made it obsolete. (We now have broadband Internet and smartphones only.) What looked like growth was really the final swell before disruption. Maintaining all these systems may have seemed inefficient, but it was necessary. The same is true for energy: overlapping infrastructures are not poor planning, but a hallmark of transition.
The key is to recognize these peaks not as setbacks, but as signs that system change is underway. What’s essential is planning their obsolescence even as they temporarily expand.
Efficiency Is the Hidden Hero
Efficiency is often overlooked in energy discussions, yet it is a foundational driver of emissions reductions and system performance. Electrified systems like EVs and heat pumps are dramatically more efficient than their fossil-fuelled counterparts — a fact that holds true even when powered by fossil-heavy grids. EVs, for instance, convert over 80% of battery energy to motion, compared to less than 25% in gasoline engines. Heat pumps can deliver three to four units of heat per unit of electricity, far outperforming traditional oil or gas furnaces.
In Québec, where electricity already makes up nearly 50% of final energy use thanks to abundant hydropower, replacing remaining oil systems with heat pumps delivers immediate environmental and cost benefits. Moreover, much of Québec’s housing stock was built in the 1970s and 1980s with electric baseboards. These are simple but demand-intensive systems. Upgrading them to cold climate heat pumps with smart thermostats not only improves household efficiency, it also frees up valuable grid capacity during winter peaks — capacity that can be redirected to support EVs or other electrified loads.
Efficiency gains go beyond equipment swaps. Insulating buildings, sealing leaks, improving windows, and modernizing industrial equipment and processes all reduce system strain and energy costs. One such industrial example is the adoption of variable-frequency drive (VFD) motors. VFDs adjust a motor’s speed and torque to match actual demand, significantly reducing energy use in pumps, fans, and compressors — applications that make up a large portion of industrial consumption. These improvements are classic no-regret measures: low-risk, low-cost, and high-impact. They cut demand, lower emissions, and enhance resilience — especially important as electrification scales.
Even in provinces or countries where the grid still relies heavily on fossil fuels, these actions reduce overall emissions across the system’s lifecycle. Efficiency should, therefore, be seen not just as a side benefit, but as a strategic enabler of the entire energy transition.
In telecom, early mobile systems had similar trade-offs. Initial digital systems — like early voice-over-IP or digital switching — were often less spectrally efficient than analog ones. Accurately transmitting 1s and 0s required more bandwidth and higher fidelity compared to analog voice. Voice quality and latency were initially worse. But digital platforms enabled new services, evolved quickly, and scaled dramatically in performance. The same logic applies to electrification: the early phase may not be perfect, but it enables a dynamic, software-enhanced, rapidly improving system architecture.
Efficiency — both in physics and system adaptability — is the reason electrification cuts emissions today and lays the foundation for deeper decarbonization tomorrow. This advantage mirrors the logic in Part 1: whether through highly efficient combined-cycle gas generation or through clean, electrified end uses like EVs and heat pumps, choosing the most efficient technology available today is a no-regret way to reduce emissions and improve system performance. The challenge, then, is not whether electrification makes sense — it’s how to scale it quickly and effectively.
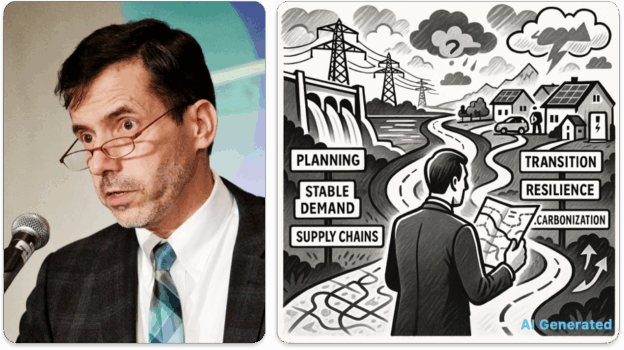
Governing in Disequilibrium
The mid-transition is marked by complexity: fast-changing technologies, slow-moving institutions, and legacy systems that can’t disappear overnight. Not all sectors advance at the same pace, and policy should reflect this heterogeneity. For instance, home heating and light-duty vehicle sectors are ripe for rapid electrification, while heavy industry and long-distance freight may need more time and targeted R&D support. A differentiated approach — matching tools and timelines to sector maturity — will produce better results than one-size-fits-all policy frameworks.
Policy must match this reality. Incentives are often crucial in expediting the implementation of electrification technologies, particularly at the consumer level, where initial costs continue to be a barrier. Subsidies for heat pumps, EVs, smart appliances, and retrofits can catalyze demand, create economies of scale in manufacturing and installation, and speed up market transformation — though these incentives should be designed to taper off as markets mature and costs decline. Meanwhile, regulatory tools — including standards for building codes, vehicle emissions, and utility performance — play a crucial role in shaping how electrification, grid upgrades, and generation buildout unfold. Together, targeted incentives and strong regulations create the enabling conditions for coordinated decarbonization.
R&D, subsidies, and governance should favour fast-cycling innovations (like DERs, digital controls, and distributed storage), which deliver rapid gains and learning cycles. These investments should be complemented by longer-term support for foundational technologies in harder-to-decarbonize sectors, and by strategies to manage the planned decline of fossil infrastructure — including retraining workers and reallocating capital.
Carbon pricing and market reform are tools — not silver bullets. While carbon pricing can be an effective tool for reducing emissions in some sectors, it is less effective at driving complex infrastructure transitions on its own. Electricity systems are not fully liberalized markets: they involve regulated monopolies, long planning horizons, and public-interest obligations. Without complementary policies — like performance standards, direct investment, and regulatory reform — price signals may simply reinforce the status quo. In electricity systems characterized by long-lived infrastructure, incumbent utilities, and planning rigidities, carbon pricing alone may increase costs without driving meaningful change. It may discourage consumption without creating the necessary conditions to shift how power is generated, delivered, and used. As with telecom, it was not pricing reform alone that enabled digital transformation, but institutional openness to new actors, technologies, and business models. A mix of capacity markets to ensure reliability, flexible tariffs to shape demand, and equity-based programs to support low-income and underserved communities should take centre stage.
Telecom regulators lagged during the mobile revolution, struggling to apply outdated rules built for analog voice services to a rapidly evolving digital landscape. This mismatch delayed innovation and created friction during a period of fundamental transformation — a cautionary tale for today’s energy regulators facing a similarly disruptive shift.
Historically, telephone companies have operated as monopolies. But competition from cable operators, multiple mobile providers, and eventually Internet-based services forced a rethinking of the entire regulatory framework. The result was a more dynamic and pluralistic ecosystem, with overlapping platforms and diverse business models that evolved on their own timelines and required differentiated oversight.
The energy sector could face a similar transformation. Distributed energy resources (DERs) such as rooftop solar, batteries, vehicle-to-grid systems, and energy aggregators, are beginning to challenge the traditional one-way, centralized utility model. In addition, new institutional forms — including municipal utilities, Indigenous energy enterprises, and energy cooperatives — are gaining traction. These actors blur the lines between consumer and producer, infrastructure and service, public and private.
Energy regulation will need to adapt — not by copying telecom’s outcome, since the final structure of the electricity sector will vary by jurisdiction, but by applying the same principle: openness to decentralization, innovation, and diversity of models. A flexible, pluralistic regulatory framework will be essential for managing this complexity and avoiding the friction that slowed telecom’s early digital transition.
Just as telecom embraced new actors and decentralization, energy systems must welcome municipal leadership, community ownership, and user-side intelligence.
Misreading the Transition
Energy systems today face challenges remarkably similar to those telecom networks encountered during their digital transition. Digital telecom technologies like DSL and VoIP had to coexist with legacy analog systems for decades, creating friction due to protocol mismatches, legacy billing systems, and inconsistent service expectations. Likewise, clean energy technologies — from distributed solar to smart thermostats — are being deployed into infrastructure built for centralized, dispatchable fossil generation. Grid codes — the technical connection standards that govern how equipment interacts with the grid — along with interconnection rules and pricing models, often lag behind the capabilities and needs of these new technologies. Energy institutions, like their telecom counterparts, must revise rules, develop new skills, and embrace structural change. The coexistence of old and new isn’t a temporary bug — it’s the defining feature of the mid-transition.
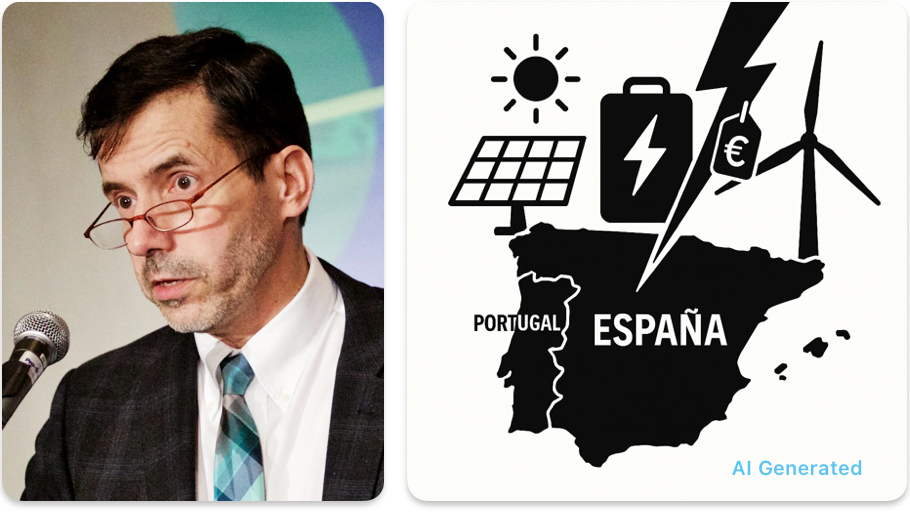
Transition systems don’t grow linearly — they oscillate. Oversupply in one part of a value chain (e.g. solar PV modules or batteries) can result from constraints elsewhere (e.g. permitting, interconnection delays, or grid integration). These mismatches often lead to price crashes or gluts, not because the technologies have failed, but because the system hasn’t caught up. This dynamic has been repeatedly observed in solar PV manufacturing: booms driven by scaling incentives followed by busts when deployment lags. These fluctuations send conflicting market signals, confuse investors and policymakers, and can undermine public confidence in the transition. Understanding this volatility as a feature of disequilibrium — not a failure — is essential.
A telling example of this broader challenge is the deployment of smart meters. In many jurisdictions, the infrastructure is already in place — often through major public investments — but the benefits are unevenly realized. Time-of-use pricing, real-time feedback, and automated demand response require more than just smart meters: they depend on appropriate regulatory frameworks, utility engagement, and customer trust. Where these elements are lacking, the value of the technology remains latent. Telecom experienced something similar with underused broadband networks in the early 2000s: the physical infrastructure was there, but the service models and demand were not yet aligned. This underscores a recurring theme of the mid-transition — that physical build out must be matched by institutional readiness and user integration.
Another lesson from telecom is the pace and frequency of system overhaul. Over just a few decades, the industry cycled through multiple generations of mobile telephony — 2G, 3G, LTE, 4G, and now 5G — and broadband technologies — Digital Subscriber Line, Hybrid Fibre coax, and now Fibre-to-the-Home — each requiring major infrastructure upgrades. Cable and copper wiring were replaced by fibre; networks were torn out and rebuilt repeatedly. This pattern of continuous reinvention was normal. In contrast, electricity systems are built for longevity, with assets expected to last 40 to 80 years. This long-horizon mindset makes the idea of regularly replacing infrastructure seem wasteful. Yet the energy transition may demand more frequent reinvestment, particularly to upgrade early solar, wind, and grid technologies. Recognizing this difference in cultural and institutional expectations is key: what telecom embraced as a pathway to progress, electricity may resist — to its own detriment. This is particularly evident in wind repowering. Early wind projects were often built with smaller turbines and lower hub heights. Many of these sites are now being dismantled and rebuilt with vastly more productive equipment, enabling greater energy output from the same location, often with fewer turbines. Far from being wasteful, repowering reflects accelerated learning and evolving design standards — a sign of maturity, not failure. The electricity sector, like telecom, must normalize reinvestment as part of long-term transformation.
Another common but misunderstood signal of progress is curtailment — the deliberate reduction of output from renewable generators when supply temporarily exceeds demand or transmission capacity. To some, curtailment appears to be waste, as if clean electricity is being thrown away. But in a system with high shares of variable renewables, some level of curtailment is both expected and economically rational. It allows planners to size generation to meet needs under most conditions, while accepting occasional excess as a trade-off for reliability and resilience. In fact, strategic overbuilding — and the resulting curtailment — can be cheaper and faster than expanding transmission or storage in the short term. As with repowering, the optics of curtailment can mislead observers into thinking the system is broken when it may actually be operating efficiently within design limits.
Conclusion
The mid-transition is messy, but navigable. Understanding it means accepting that dual systems, temporary contradictions, and fast-shifting technologies are not signs of failure, but indicators of forward movement. Just as telecom weathered overlapping networks, regulatory lag, and public confusion on the way to transformative change, the energy system must do the same — but with higher stakes and less time. By focusing on no-regret actions, embracing efficiency, aligning governance with technology, and anticipating perception gaps, we can design a transition that is not only faster and cleaner, but fairer and smarter. The transition is underway. It won’t be perfect. But it can be planned.