In the first article, I looked at diversity in Hydro Québec’s senior management: the place of women, visible diversity in the organization charts, and the limits of an analysis based on public documents.
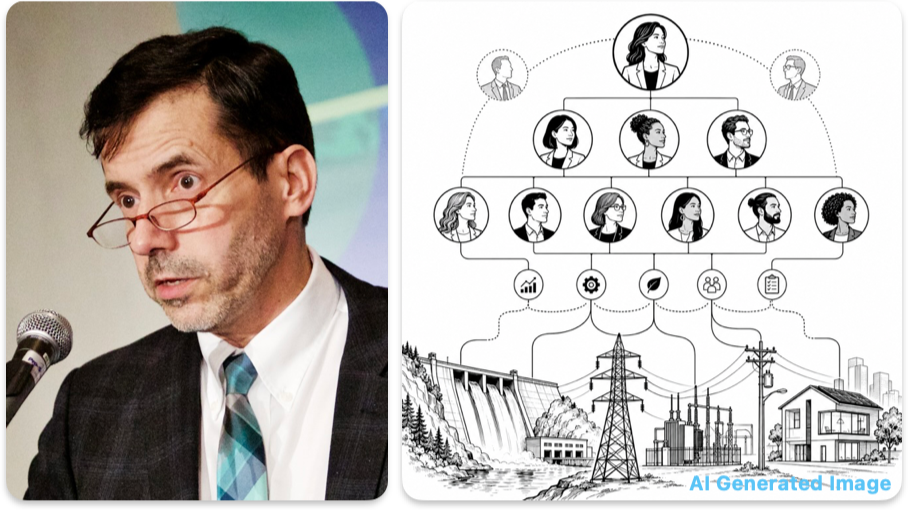
This second text focuses on another strong signal: the growth in the number of leaders visible in senior management organization charts.
(LinkedIn: https://www.linkedin.com/pulse/hydro-québec-more-leaders-do-what-benoit-marcoux-46enc/)
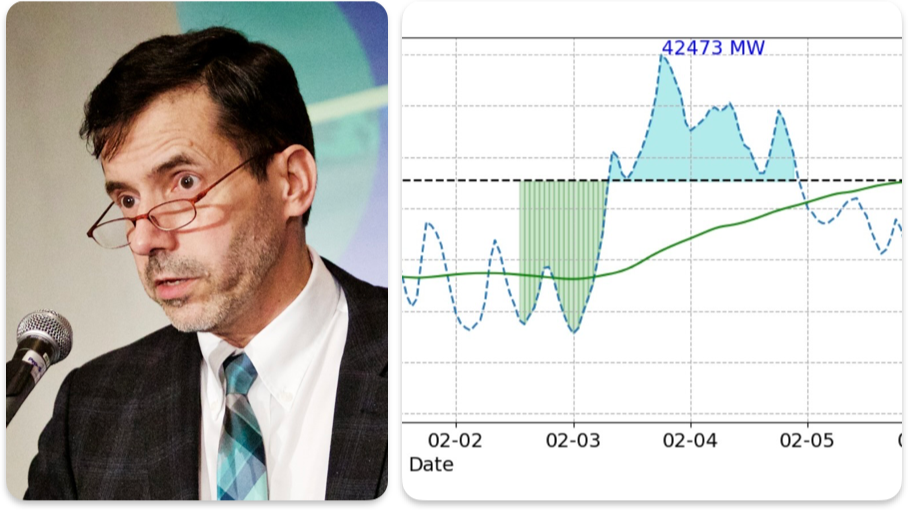
Since 2005, the number of people at director level and above has increased from about 120–130 to just over 200. That is an increase of more than 50%, essentially since 2015.

The chart clearly shows the contrast between the two dynamics. The total workforce declined slightly until the mid-2010s, then rose sharply. The number of people visible in senior management remains fairly stable until the Martel period, then increases markedly from the late 2010s onward.
Taken alone, the number of people in senior management can easily lead to an overly quick conclusion: Hydro-Québec has simply become heavier.
That is partly possible. But the story is more interesting than that.
The increase in the number of leaders is neither regular over time nor evenly distributed across functions. It also accompanies a deeper change in organizational logic.
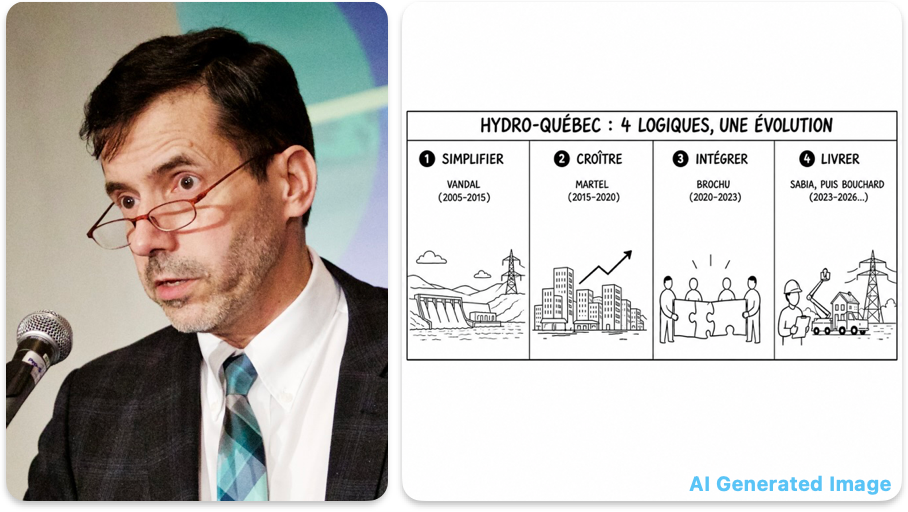
The simplest reading is probably this: with Thierry Vandal, Hydro-Québec mainly seeks to simplify; with Éric Martel , it seeks to grow; with Sophie Brochu , it seeks to integrate; under Michael Sabia and Claudine Bouchard, ASC, it mainly seeks to deliver.
How I Counted
I reviewed 27 Hydro-Québec senior management organization charts from 2005, at the start of Thierry Vandal’s presidency, through 2026.

In practice, these organization charts correspond to Hydro-Québec’s management level 3 and above: directors, senior directors, vice-presidents, and the other positions visible in the charts.
This choice has an important limitation: it does not capture Hydro-Québec’s entire management structure. Below these levels, there are also level 4 and 5 managers and, in some cases, team leaders, coordinators and other supervisory roles. The analysis therefore does not cover all managers in the company.
It remains relevant, however, because at Hydro-Québec, major decisions are generally made at director level and above. That is where the major trade-offs, organizational priorities and the most visible positions in the power structure sit.
I excluded vacant positions. People who appeared more than once were counted only once. For interim positions, I kept the persons, but assigned them to the highest level at which they appeared. To compare with the total workforce, I used Hydro-Québec’s annual reports.
The Transformation Phases
The phase-by-phase reading is more revealing than a simple upward curve.
The growth in the number of leaders did not really begin in 2005. It is concentrated mainly from Martel onward, after 2015, then changes under Brochu with “One Hydro,” before continuing under Sabia and now Bouchard in a context of accelerated execution.
Vandal: Simplify
Under Thierry Vandal, from 2005 until Éric Martel’s arrival, the number of people visible at director level and above remains broadly stable.
This is not a period of marked growth. Hydro-Québec seems instead to follow a logic of simplification, rationalization and cost control.
The structure is then based on functional separation. In simple terms, the major functions remain in their own columns: generation on one side, the transmission grid on another, then the distribution grid and retail customer sales in one combined group. It is a traditional, legible and fairly siloed organization, in which each major function keeps its own chain of command.
This can also be seen in some more specific choices expressed in the organization chart, such as the merger or rationalization of telecommunications functions. It can also be seen in projects such as smart meters, which reduce the recurring costs associated with manual meter reading.
In other words, this period does not really add new families of functions to the organization chart. It mainly seeks to consolidate, simplify and do better with a relatively stable structure. This logic of functional separation continues under Martel, before being largely dismantled under Brochu with “One Hydro.”
Martel: Grow
Éric Martel arrives from the private sector with clearer priorities: customer service, growth of activities and productivity.
The stated objective is ambitious: to lay the groundwork to double revenues in fifteen years.
The functional separation structure remains in place, but strategy, development and transformation functions are added around it in the organization chart.
This is also the period when certain new capabilities become more visible: a more direct public presence, Hilo demand management as a new series of functions downstream of the meter, and a more strategic approach to material procurement.
In other words, Martel does not only add positions. He mainly adds functions related to growth, customer relations, development and productivity.
Brochu: Integrate
With Sophie Brochu, the emphasis changes.
The revenue-growth narrative is abandoned. The central point becomes integration. “One Hydro” aims to reduce silos and better coordinate the company’s major functions. This is therefore the moment when the traditional functional separation between the major functions is dismantled at the top of the organization chart.
The idea is no longer primarily to sell more. It is to make better use of available electricity, strengthen energy efficiency and demand management, and make better trade-offs at the best collective cost.
In the organization charts, this logic is visible in the rise of transversal functions. Positions related to strategy, planning, development, customers, digital, governance, risk, performance, procurement and innovation have risen from about 40 before “One Hydro” to more than 60 in recent organization charts. There are therefore more functions that do not correspond to a traditional electricity business line, but that cut across several functions.
This is consistent with the spirit of “One Hydro,” but it increases the organizational distance between the components of the same business line.
Sabia, then Bouchard: Deliver
Under Michael Sabia and now Claudine Bouchard, the priority appears to be less about redrawing the organization than about setting transformative objectives and executing. The count of visible functions in the organization charts therefore suggests that the Sabia-Bouchard period consolidates the structure already made more integrated under Brochu, while orienting it more toward execution: projects, operations, maintenance, reliability, procurement and coordination of deployment.
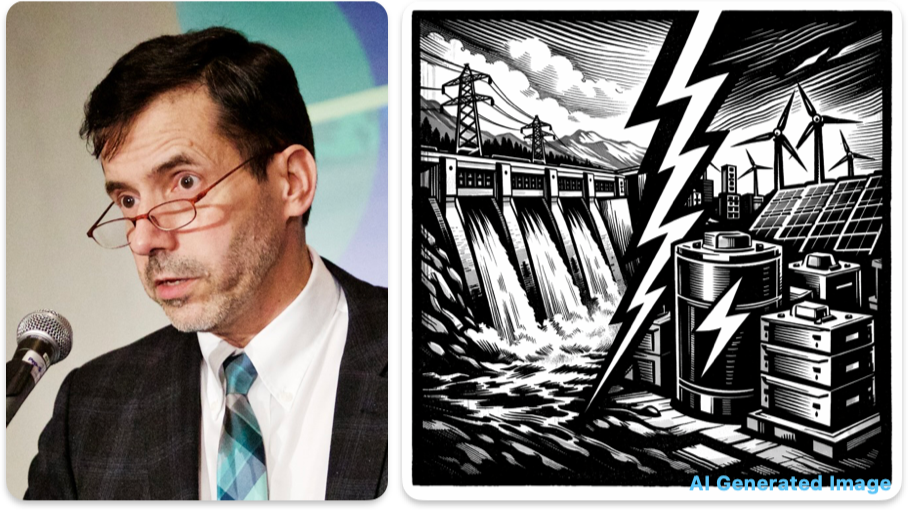
The context is one of demand growth, connections, reliability, procurement, grid modernization and the 2035 Action Plan.
The 2035 Action Plan plays an important role here. It gives the organization a clearer target, a faster pace and much stronger execution pressure. Hydro-Québec must now connect more, build more, buy more, coordinate more and deliver within tighter timelines.
The classic functions of generation, transmission and distribution also reappear lower down in the organization chart, while the customer function remains clearly separate.
This suggests a possible limit of the “One Hydro” model. By integrating at the top, the organization must recreate lower down some of the functional distinctions it sought to overcome.
The count of visible functions in the organization charts therefore suggests that the Sabia-Bouchard period consolidates a structure already made more integrated under Brochu, while orienting it more toward execution: projects, operations, maintenance, reliability, procurement and coordination of deployment.
A Necessary Caution: Possible Title Inflation
An important nuance must nevertheless be added.
Part of the increase in the number of leaders may reflect new functions or expanded missions. But another part may also come from title inflation or from some positions moving upward in the organization chart.
In other words, an increase in the number of directors and above does not automatically mean that Hydro-Québec has added an equivalent number of real new layers of power or coordination. In some cases, it may be the same work, but with a higher hierarchical level or a more developed structure around a function that already existed.
The example of the direction responsible for “energy movements” — the transmission system operator — illustrates the point well. Initially a director-level function, level 3, it became, in 2015, a senior director-level function, level 2, with its own directors. In such a case, the number of positions visible in the organization chart increases, even if it does not necessarily represent the appearance of an entirely new mission.
This nuance does not overturn the analysis. It makes it stronger.
Yes, the organization chart is growing. Yes, new functions are appearing or taking up more space. But we should keep in mind that part of the observed growth may also come from upgraded status, finer segmentation or more formal structuring of functions that were already present.
That is another reason why the right topic is not only the raw number of leaders. The real topic is what the organization wanted to make more visible, more autonomous, more structured or more strategic.
The Right Indicator Is Not Only the Number
It would be too easy to say: more leaders, therefore more bureaucracy.
That is not necessarily wrong, but it is incomplete.
Part of the growth in senior management may be justified. Hydro-Québec is now managing a more complex system than it did twenty years ago. Demand growth has returned. Supply chains are more fragile. Acceptability issues are heavier. Industrial customers need more electricity. Projects have to move faster. Digital technology and cybersecurity are becoming critical.
In this context, adding capabilities to strategy, procurement, digital, customer functions, acceptability or governance can be a good thing.
But there is a test.
Does this structure help the organization decide faster, prioritize better, execute better and deliver projects?
Or does it multiply committees, dependencies, grey areas and mandatory check points?
That is where the number of leaders becomes interesting. Not as an automatic criticism, but as an organizational symptom.
What the Organization Charts Suggest
The organization charts do not measure performance. They do not say whether projects move faster, whether decisions are better or whether costs are better controlled.
But they do show a transformation.
- With Vandal, Hydro-Québec simplifies.
- With Martel, it adds growth functions.
- With Brochu, it adds integration functions.
- Under Sabia and Bouchard, it strengthens steering and execution functions.
That is probably the simplest and most useful reading.
The Real Issue: Execution Capacity
Hydro-Québec is entering a period in which execution will matter more than strategy.
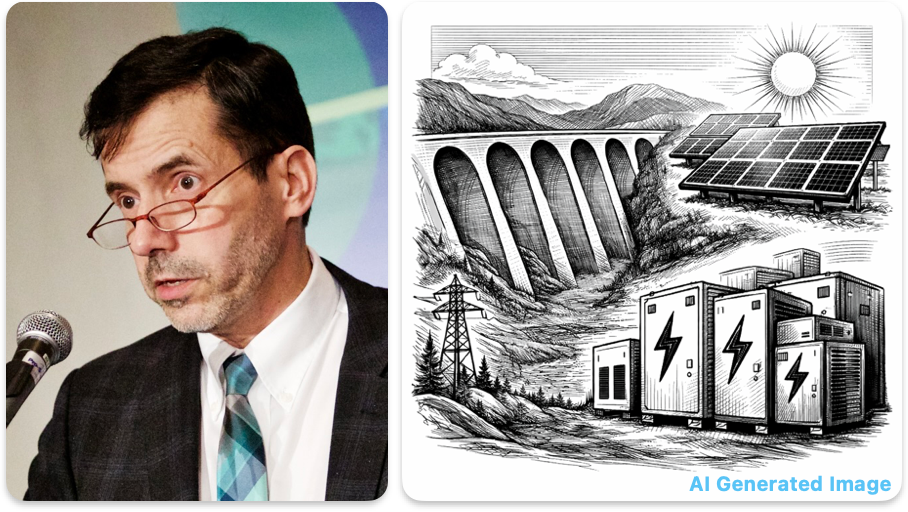
Good orientations will not be enough. The organization will have to connect faster, build faster, procure better, standardize more, maintain reliability, manage peaks, integrate new resources, work with communities and industry, modernize networks and keep costs under control.
In this context, the senior management structure must be judged by its ability to deliver.
A more developed organization may be more competent, more robust and better equipped to manage complexity.
It can also become slower if responsibilities are poorly defined.
That is probably the real question behind the evolution of the organization charts: has Hydro-Québec added the right capabilities, in the right places, with enough clarity to deliver the energy transition?
Conclusion
The organization chart does not only show a company that is getting bigger.
It shows a company that is changing logic: it simplifies, then seeks to grow, then tries to integrate, then has to deliver.
The initial period is marked more by stability, simplification and cost control. Additions to senior management then come with a logic of growth, then with a logic of integration, before shifting toward the harder logic of execution.
This is not necessarily a bad thing. Several of the added or strengthened functions have become essential.
But the real question is not only whether there are more leaders.
The real question is whether this densification improves execution, or whether it adds organizational distance at the very moment when Hydro-Québec must accelerate.
That is probably where an important part of the success of the 2035 Action Plan will be decided.