Category Archives: Distributed Generation

Residential Light-Duty EV V2G

There’s an increasing level of interest in the industry to use the energy stored in EVs to manage demand and supply peaks, drawing on the EV batteries to support the grid, referred to as Vehicle-to-Grid (V2G). In concept, V2G is similar to using stationary batteries in people’s home as a distributed energy resource, a concept that has been growing in interest, with Green Mountain Power being the first utility with tariffed home energy storage programs[i] for customers. However, in some ways, V2G has more potential than stationary batteries, but also more challenges.

With V2G, EVs may be used as distributed grid-resource batteries. Then, a plugged-in EV with a sufficiently charged battery and a bidirectional charger may get a signal to discharge the battery when called upon to support the grid (demand response) or to optimize a customer’s electricity rates (tariff optimization). 

When associated with a home energy management system, V2G may be used as a standby power source during outages, a feature referred to as Vehicle-to-Home (V2H). V2G is also related to Vehicle-to-Load (V2L), where the vehicle acts as a portable generator. Collectively, these functions are often referred to as V2X, although they all have their own characteristics, as described below.

The Case for Residential Light-Duty EV V2G

The case for residential light-duty EVs is compelling because the batteries in modern light-duty EVs are large in comparison to their daily use, being sized for intercity travel (like going to the cottage on the weekend, or an occasional trip to visit friends and family), leaving significant excess capacity for use during peaks. For example, modern long-range EVs have batteries of 60 kWh to 100 kWh, for a range of 400 km (250 mi.) to 600 km (400 mi.) — significantly more than what is required for daily commute by most drivers. This means that light-duty passenger vehicles can leave home after the morning peak with less than a full battery and still come back at the end of the day with a high remaining state of charge for use during the evening peak. 

In terms of capacity, residential V2G compares favorably to home energy storage systems and commercial EV fleets. Indeed, home energy storage systems (like the Tesla Wall, with 13,5 kWh of usable energy[ii]) have far less capacity than modern EVs. As for medium or heavy-duty fleet EVs, they have a high duty cycle, with their batteries size usually optimized for their daily routes, leaving little excess capacity for use by a V2G system during peaks, with some exceptions, such as school buses[iii].

Extracting value from residential light-duty EV V2G can be achieved at the consumer level or at the utility level, but depending on the local regulatory framework and the energy, capacity or ancillary market structure:

  • Consumers may use V2G to leverage utility dynamic rates and net metering tariffs (or other bidirectional tariffs), charging the EV when rates are low and feeding back to the grid when rates are high. Typically, the consumer would own the V2G system. The consumer (or a third-party service company hired by the consumer) controls when the EV is charged and when it is discharged, following rules to ensure that the consumer driving needs and cost objectives are met.
  • A customer’s utility may also control the V2G system to optimize grid supply, charging the EV when wholesale prices are low or when generating capacity is aplenty, and feeding back to the grid when market prices are high or capacity constrained, therefore benefitting all ratepayers. As enticement for the consumers to participate, the utility would need to subsidize the V2G system or to have a recurring payment to the consumer.
  • In some jurisdictions, third-party aggregators may act as an intermediary between consumers and the energy, capacity or ancillary markets. Consumers are compensated by a subsidy, a recurring payment, or a guaranteed rate outcome. 

However, the potential of V2G also depends on automakers. Automakers are announcing V2X features, such as Volkswagen[iv] and Hyundai[v]. Aware of the economic potential of V2G and their gatekeeper position, automakers will want to extract some value from it, especially as V2X would increase the number of charging and discharging cycles of the battery, possibly affecting its service life, the warranty costs and civil liability. Automakers could extract value from V2G a few ways, including with an ordering-time option, a one-time software option, or even as an annual or monthly software fee to enable to a V2G function.[vi] Here again, cooperation among automakers will be important as the V2G interfaces to the grid are being defined; there are some signs that such cooperation is starting to take place, as shown by the common position of the German Vehicle Association, the VDA.[vii]

V2G vs. V2H vs. V2L

V2G should be distinguished from Vehicle-to-Home (V2H) and Vehicle-to-Load (V2L) use cases, as V2H and V2L do not feedback power to the electrical grid to relieve grid constraints or optimize customer rates. 

  • V2H is analogous to using the EV battery as a standby generator for use during a power outage. A V2G vehicle, when coupled with a home energy management system, may also offer V2H. 
  • V2L is like using a portable generator to power tools at a construction site or a home refrigerator during a power outage. V2G vehicles may or may not have plugs for V2L, although this is an increasingly common EV feature. 

V2G and V2H or V2L have different power electronics and standards to meet. V2H and V2L are easier to implement as they do not have to meet grid connection standards, while V2G systems must meet DER interconnection standards. An example is Rule 21 in California which makes compliance with IEEE 2030.5 and SunSpec Common Smart Inverter Profile (CSIP) standard mandatory distributed energy resources.[viii] On the other hand, a V2H or V2L vehicle (or its supply equipment) needs to have a grid-forming inverter, while a V2G inverter acts as a grid-following power source.[ix] [x]

On-Board V2G (AC) vs. Off-Board V2G (DC)

Electrically, V2G (and V2H) may come in two varieties: on-board V2G (AC) and off-board V2G (DC).[xi]

On-Board V2G (AC)

With on-board V2G, the EV exports AC power to the grid, through a home EV supply equipment. For light-duty vehicles, the connector is SAE J1772; SAE J3072 defines the communication requirements with the supply equipment. The supply equipment needs to be bidirectional and to support the appropriate protocol with the vehicle and compatible with the local grid connection standards.

An issue is that the standard Type 1 SAE J1772 plug used in North America is a single-phase plug and does not have a dedicated neutral wire for the split phase 120/240 V service used in homes. This means that the J1772 plug can be used for V2G (feeding back to the grid at 240 V) but can’t be used directly (without an adaptor or a transformer) for split phase 120/240 V V2H. This issue reduces the customer value of the system, as AC V2G can’t readily be used as a standby generator for the home. 

Many EVs come with additional plugs, in addition to J1772, for 120/240 V V2L applications. Examples included the NEMA 5-15 120 V plug (common residential plug) and the twist-lock L14-30 split phase 120/240 V plug (often seen on portable generators). The Hyundai IONIQ 5[xii] and the GMC Hummer EV[xiii] are examples of vehicles with additional plugs. 

As of this writing, commercially available EVs in North America do not support on-board V2G, but some have been modified to test the concept for pilot programs.[xiv] However, many automakers have announced vehicles with bidirectional chargers, and possibly AC V2G, although there are little publicly available specifications. 

Off-Board V2G (DC)

With off-board V2G, the EV exports DC power to a bidirectional DC charger. 

Bidirectional charging has been supported by the CHAdeMO DC fast-charging standard for quite some time, and the Nissan Leaf has offered the feature since 2013[xv]. Several light-duty DC V2G pilots therefore used these vehicles. However, with the new Nissan Ariya electric crossover using CCS instead of CHAdeMO, Nissan effectively made CHAdeMO a legacy standard in North America.[xvi]

CCS is an alternative for off-board V2G, but, unfortunately, CCS does not yet support bidirectional charging. CharIN[xvii], the global association dedicated to CCS, is developing the standards for V2G charging[xviii]. The upcoming ISO 15118-20 is expected for the fourth quarter of 2021 and will include bidirectional charging. This will mark the official start of interoperability testing. However, it will take time to reach mass-market adoption since the new standard needs to be implemented and tested beforehand to overcome potential malfunctions on software and hardware side.[xix] BMW, Ford, Honda, and Volkswagen have all announced plans to incorporate bidirectional charging and energy management, with an implementation target of 2025, but it is not clear if this is for V2G AC or V2G DC.[xx]

A critique of off-board V2G is the high cost of bidirectional DC chargers.[xxi] A solution may be to combine the bidirectional charger with a solar inverter, integrating power electronics for residences with both solar panels and EV charging. The dcbel r16 is an example of such an integrated approach[xxii], combining a Level 2 EV charger, a DC bidirectional EV charger, MPPT solar inverters, a stationary battery charger/inverter and a home energy manager in a package that costs less than those components purchased individually.[xxiii]


[i]        See https://greenmountainpower.com/rebates-programs/home-energy-storage/powerwall/ and https://greenmountainpower.com/wp-content/uploads/2020/11/Battery-Storage-Tariffs-Approval.pdf, accessed 20210526

[ii]       See https://www.tesla.com/sites/default/files/pdfs/powerwall/Powerwall%202_AC_Datasheet_en_northamerica.pdf, accessed 20211008.

[iii]      While medium and heavy vehicles like trucks and transit buses generally have little excess battery capacity, school buses during summer are an exception, as many remain parked during school holidays. See, for example, https://nuvve.com/buses/, accessed 20211208.

[iv]       See https://www.electrive.com/2021/01/27/vw-calls-for-more-cooperation-for-v2g/, accessed 20211220.

[v]        See https://www.etnews.com/20211101000220 (in Korean), accessed 20211210.

[vi]       For example, Stellantis targets ~€20 billion in incremental annual revenues by 2030 driven by software-enabled vehicles. See https://www.stellantis.com/en/news/press-releases/2021/december/stellantis-targets-20-billion-in-incremental-annual-revenues-by-2030-driven-by-software-enabled-vehicles, accessed 20211207,

[vii]      See https://www.mobilityhouse.com/int_en/magazine/press-releases/vda-v2g-vision.html, accessed 20211210.

[viii]     See https://sunspec.org/2030-5-csip/, accessed 20211006.

[ix]       See https://efiling.energy.ca.gov/getdocument.aspx?tn=236554, on page 9, accessed 20211208.

[x]        “EV V2G-AC and V2G-DC, SAE – ISO – CHAdeMO Comparison for U.S.”, John Halliwell, EPRI, April 22, 2021.

[xi]       See http://www.pr-electronics.nl/en/news/88/on-board-v2g-versus-off-board-v2g-ac-versus-dc/, accessed 20211008, for an in-depth discussion of on-board and off-board V2G.

[xii]      See https://www.hyundai.com/worldwide/en/eco/ioniq5/highlights, accessed 20211006.

[xiii]     See https://media.gmc.com/media/us/en/gmc/home.detail.html/content/Pages/news/us/en/2021/apr/0405-hummer.html, accessed 20211008.

[xiv]     See https://www.energy.ca.gov/sites/default/files/2021-06/CEC-500-2019-027.pdf, accessed 202112108.

[xv]      See https://www.motortrend.com/news/gmc-hummer-ev-pickup-truck-suv-bi-directional-charger/, accessed 20211008.

[xvi]     See https://www.greencarreports.com/news/1128891_nissan-s-move-to-ccs-fast-charging-makes-chademo-a-legacy-standard, accessed 20211008.

[xvii]    See https://www.charin.global, accessed 20211008.

[xviii]   See https://www.charin.global/news/vehicle-to-grid-v2g-charin-bundles-200-companies-that-make-the-energy-system-and-electric-cars-co2-friendlier-and-cheaper/, accessed 20211008.

[xix]     Email received from Ricardo Schumann, Coordination Office, Charging Interface Initiative (CharIN) e.V., 20211015

[xx]      See https://www.motortrend.com/news/gmc-hummer-ev-pickup-truck-suv-bi-directional-charger/, accessed 20211008.

[xxi]     See, for example, https://thedriven.io/2020/10/27/first-vehicle-to-grid-electric-car-charger-goes-on-sale-in-australia/, accessed 20211012.,

[xxii]    See https://www.dcbel.energy/our-products/, accessed 20211012. 

[xxiii]   See https://comparesmarthomeenergy.com, accessed 20211210. 

A Perspective on Canada’s Electricity Industry in 2030

I wrote this piece with my friend Denis Chartrand as a companion document for my CEA presentation back in February 2018 (See http://benoit.marcoux.ca/blog/cea-tigers-den-workshop/) but I now realize that I never published it. So, here it is!

Canada Electricity Industry 2030 20180221

Barbarians at the Gate (or: How to Stop Worrying and Love Your Customers)

This mouthful title was the title of my presentation today at the Smart Grid Canada conference in Montréal.

As usual, it is written in my somewhat funky style and provocative, but was well received.

Let me know what you think!

SGC20180912 BMarcoux

Customers of Electric Utilities Are Redefining Quality

Traditional utility wisdom in Canada is that customers are satisfied with the current level of reliability and that improving reliability would only increase costs and push rates up.

The new reality of electric utilities upends this traditional wisdom.

Customers are redefining what is meant by quality. Traditionally, Canadian Utilities used duration of interruptions per year, or SAIDI[i], as their main measure of reliability. Some utilities report the frequency of interruptions per year, SAIFI, as well. A limitation of SAIDI and SAIFI is that interruptions of less than a minute are not included, presumably under the assumption that customers do not care that much about short interruptions. This might have been true in the analog world of years past, but it is not anymore, with even a short interruption resetting our electronic devices. Furthermore, with the fuse saving protection strategy that most Canadian Utilities have adopted on their distribution feeders, short interruptions happen more frequently than longer ones, and are therefore noticed more.

Even a short interruption resets common electronics, like my microwave oven above. This gave birth to the “blinking clock” syndrome, a stark reminder to residential customers that an outage occurred and that their utility has failed them – again. (Photo by the author)

ENMAX, when justifying its distribution automation projects within the performance-based regulation scheme of Alberta, based its analysis on the cost of sustained and momentary service interruptions, with the values for its various customer classes as shown in the table below.[ii]

Table: Estimated ENMAX Customer Class Interruption Costs

Duration Residential Commercial Industrial Weighted Average
30 Minutes


$3.02 $992 $3,641 $92.77
Momentary
(% vs. 30-Min.)
$2.71 (90%) $757 (76%) $2,354(65%) $69.12(75%)
Customer mix 92.2% 7.3% 0.5% 100%

The table is interesting for two reasons:

  • On average, the costs to customers of a momentary interruption is 75% that of the cost of a 30-minute interruption, but up to 90% for residential customers. The very small difference in cost between a momentary outage and a 30-minute outage explains why outage frequency is a higher concern than length of outages for residential customers.[iii]Due to the prevalence of the fuse saving protection strategy on electrical distribution feeders in Canada,[iv]there are far more momentary service interruptions than sustained ones – momentary interruptions therefore become the primary concern of customers.
  • The bulk of the economic cost of service interruptions is borne by commercial and industrial customers. While residential customers are far more numerous, the cost per interruption is low. However, residential customers can be more vocal in their complaints in social and traditional media.

This situation is likely to get worse with widespread customer-owned distributed energy resources: owners of distributed energy resources actually lose money during power disturbance. Distributed generators or resources may be thrown offline often for minutes, for safety reasons and to protect the equipment. This results in loss revenue for owners of distributed generators selling back to the grid, or additional costs for those who were offsetting power otherwise purchased from the grid. Overall, the percentage of time when distributed generators are offline because of service interruptions is relatively small, and so is the unsold energy or the energy additionally bought by the customers while waiting for generation to come back online. However, those interruptions may also cause power generation or grid support contracts to be broken, which may carry penalties. Customers may also have to pay additional demand charges, often a large share of the utility costs of business customers.

Service interruptions also cost money, to utilities which is ultimately paid for by customers through higher rates – another key determinant of customer un-satisfaction. First, service interruptions cause power flow and voltage fluctuations as distributed generators trip and come back, and loss of generation and dynamic resources for the grid operator. In an electric network relying partly on distributed energy resources, service interruptions mean additional complexity to maintain stability of the grid and higher costs for network operators who then have to rely on backup resources. Service interruptions even increase operating costs. Fuse saving does not always work: on average, about half of fuse replacements have unknown causes or causes that should normally have been eliminated by fuse saving, such as animal contact.

By the way, the telecom industry also went through a redefinition of what customers mean by quality. It used to be that the main quality measure was voice sound quality during a call[v]. However, voice sound quality has actually gone down in the last decades – the rotary black phone in your grandmother’s old house sounded better than your new iPhone. Nowadays, customer satisfaction is driven more by the convenience of mobility and the possibility of easily doing videoconferencing or multiple parties calls.

In summary, with increasing dependence on reliable power for modern way of life, plus distributed generation earning revenue for customers, outage frequency will become a more and more important factor for customer satisfaction. All this being said, there is hope – new smart grid approaches and protection strategies can result in fewer service interruptions, leading to higher customer satisfaction and lower cost for utilities.


[i]       SAIDI means System Average Interruption Duration Index. SAIDI is the average duration of all the outages seen by customers over the course of a year. In Canada, only interruption durations of more than 1 minutes accrue to SAIDI. Interruptions of less than a minute are considered momentary and do not count toward SAIDI.

[ii]       Evaluation of PowerMax Distribution Automation Strategy, ENMAX Power Corporation, prepared by Quanta Technology, November 29, 2011, page 23.

[iii]     Assessing Residential Customer Satisfaction for Large Electric Utilities, Lea Kosnik et al., Department of Economics, University of Missouri—St. Louis, May 2014.

[iv]      Fuse saving is an electrical protection strategy used on many distribution feeders in Canada. The objective is to avoid that fuses installed on lateral taps blow for a non-persistent fault, such as an animal contact or a lightning strike. With fuse saving, a mainline or station a circuit breaker or recloser is used to operate faster than the lateral tap fuses. A few seconds after an initial fault, the breaker reclose, re-establishing power. If the fault is non-persistent, power will be restored. If not, it may retry later. If the fault is persistent, the breaker will eventually reclose and let the lateral fuse blow, isolating the fault. Because most faults are non-persistent, fuse saving prevents needless fuse blow, avoiding sustained service interruption for customers on the affected lateral. The main disadvantage of fuse saving is that all customers on the circuit see a momentary interruption for lateral faults.

[v]       The quality of a call is given by its Mean Opinion Score (MOS), a subjective measurement where listeners sit in a quiet room and rate a telephone call on a scale of 1 to 5. It has been in use in the telephony industry for decades and was standardized in an International Telecommunication Union (ITU) recommendation.

The Costs of Wind and Solar PV Systems Are Down – Way Down

Summary:

Insight  1
Utility-scale solar PV costs are dropping ~20% a year (including solar panels, inverters, balance-of-system, installation, and operations) while panel efficiency is improving. Solar is the renewable sector with the most patents, promising further improvements.

Insight  2
Onshore wind costs are dropping ~6% a year, and onshore wind is currently the least expensive new generation source. Wind turbine technology continues to improve through a combination of taller towers and wider rotor diameters.

Insight  3
Prices are below 2¢/kWh (unsubsidized) for projects auctioned to be delivered in 2019 and 2020. Continuing cost drivers include:  larger-scale manufacturing in low-cost locations, tighter integration, higher performance, larger farms with better economy of scale, repowering of old sites with good wind or solar resources, and automation of operations.

Insight  4
The cost reduction curve of commercial solar PV over time is about two years behind the cost curve of utility-scale solar farms. Residential is two years behind commercial. Southern Alberta and Saskatchewan have the best solar resource in Canada, one year behind Southern United States. The rest of Southern Canada is just another year behind.

The rate of cost reduction in wind and solar PV systems has been wholly impressive. Solar PV modules are 20% of the cost they were in 2010. Wind turbine prices have fallen by around half over a similar period, depending on the market. Costs are dropping so quickly that some governments feel compelled to protect fossil generators. For example, in 2017, there was a bill in front of the Wyoming State Legislature to tax renewables in order to favor local coal producers. The bill went nowhere, but you know that you are onto something when it is being taxed.[i] Similarly, the U.S. Department of Energy attempted to protect coal and nuclear producers in the name of keeping power grids dependable, but this was eventually rejected by the Federal Energy Regulatory Commission in early 2018.[ii]

Spurred by a global competitive race sponsored by states and large corporations, a confluence of performance improvements, supply chain efficiencies and business innovations is driving cost reduction trends for renewables, with effects that will only grow in magnitude in 2018 and beyond.

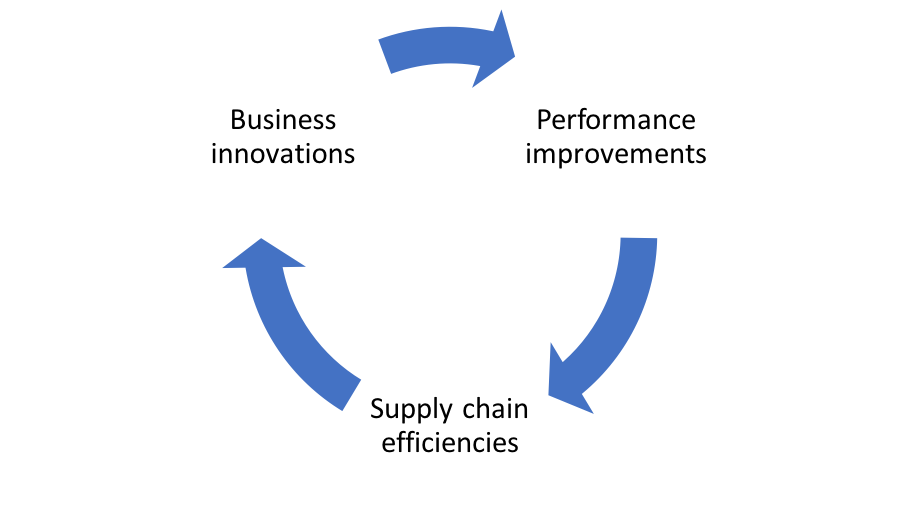
Figure 1 A confluence of performance improvements, supply chain efficiencies and business innovations is driving cost reduction trends for renewables

Performance improvements

The last decade has seen a string of innovations and inventions for renewable energy technology. The large number of patents issued is a measure of the level of innovation, and, perhaps surprisingly, China has become the leading innovator by this measure. From 2000 to 2016, over 575,000 patents were filed for renewable energy:[iii]

  • Half of them since 2010.
  • 55% were for solar energy and 20% for wind energy. Hydropower, a mainstay of Canadian Utilities, accounted for just 6% of patents.
  • Greater China (including Hong Kong and Taipei) accounted for almost a third of patents, well ahead of second-place United States at 18%. Canada has less than 1.5% of those patents.

Technology improvements primarily aim at raising the capacity factor, generating more energy from available resources, and reducing installations, operating and maintenance costs.

For example, in the last decade, the efficiency of solar PV panel went from about 12% to a range of 18.8-23.5%. By 2424, industry expectations place the range at 19.8-25%.[iv] Increased use of sun tracking for utility-scale plants and improvements in inverter losses are also contributing to the improvement of the capacity factor of solar PV systems, with utility-scale PV systems increasing from an average of 13.7% to 17.6% (see Figure 2).[v]

For wind power, higher hub heights allow turbines to access higher wind speeds[vi], with each additional meter of hub height added to a wind turbine increasing the annual energy yield by 0.5 to 1 percent[vii]. Average rotor diameter and nameplate capacity (in MW) have also significantly increased since 2010[viii]. Offshore installations allow even larger turbines, with the 9.5 MW Vestas V164 currently holding the world record[ix] and General Electric developing an even larger Haliade-X 12 MW model[x].  As the market for wind turbines expands, manufacturers are also offering a broader range of models to allow developers to choose the best models for the site constraints they are facing (e.g., strong winds, light winds, wind variability, setting issues, etc.).[xi] All this contributes to better wind capacity factor: average capacity factor for onshore wind plants increased from around 20% in 1983 to around 29% in 2017, with average capacity factor for newly commissioned offshore plants routinely reaching 40% (see Figure 2)[xii], with a new offshore floating wind farm, Hywind Scotland, achieving a 65% capacity factor from November 2017 through January 2018.[xiii]

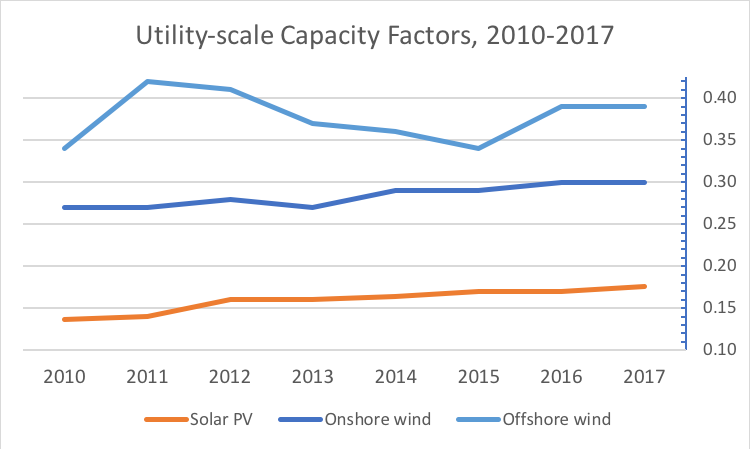
Figure 2 Capacity factors of newly commissioned systems have increased since 2010.[xiv]

Supply chain efficiency gains

As the market for renewable power generation systems expands, the industry sees increasing economies of scale in manufacturing, better vertical integration of manufacturers and consolidation among manufacturers, all fueled by a more competitive global supply chain. Again, China stands as a model, for example creating the largest power company by combining Shenhua Group and China Guodian. Groups such as this are active as foreign investment agents of China, using Chinese wind turbines and solar panels, along with Chinese engineering expertise, to develop renewable wind and solar plants across the world.

With larger scale operations, manufacturers are introducing process improvements that reduce material and labor needs, while reducing overhead. The supply chain gets more and more optimized with product better adapted to local markets and resource conditions.

As a result of these efficiencies and a robust international competitive environment for developers, the installed costs of utility-scale solar PV projects fell by 68% between 2010 and 2017. Installed costs for onshore wind projects fell by 20%. For offshore wind, the total installed costs fell by 2%.

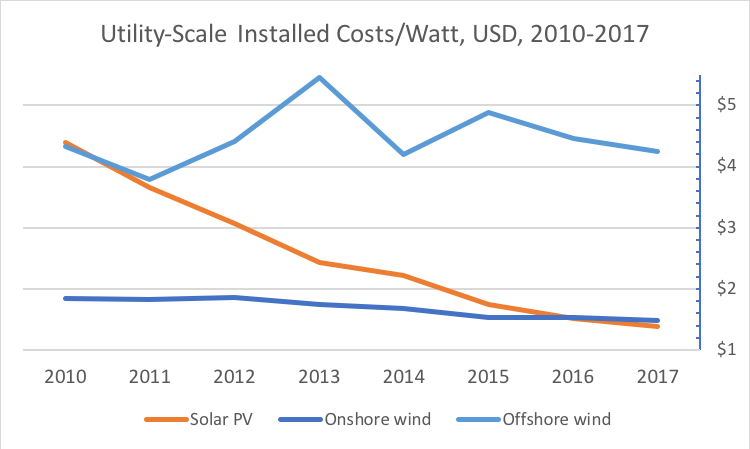
Figure 3 Installed costs have come down since 2010, on average 20%/year for solar PV.[xv]

It is striking that wind and solar PV costs went down so much while efficiency went up at the same time.

For wind electricity generation, installed cost reductions have been driven by declines in turbine prices which, which fell from a range U.S.$1,600-2,000/kW in 2008 to U.S.$800-1,100/kW for recent turbine orders.[xvi] In 2017, one developer saw a 30% reduction in turbine costs and foresees another 10% decline per year through 2020.[xvii] Even as price went down, the profitability of turbine manufacturers has generally rebounded since 2012,[xviii] with the price declines explained by turbine scale, offshoring of key components by European manufacturers and the rise of Chinese manufacturers[xix]. As a result of cost decline and the greater efficiency of new turbines, repowering old wind farms with new turbines is gaining traction.[xx]

Figure 4 compares the reduction in solar PV installed costs for utility scale (100 MW), commercial (200 kW) and residential solar PV (5.7 kW) in the U.S. market, from 2010 to 2017. Overall, the costs of utility scale have declined 20% per year on average since 2010, while the costs of residential and commercial U.S. systems have declined about 14% per year on average. As of 2017, residential installed costs are 2.5 times higher than utility-scale solar PV; commercial installed costs are in the middle, at 1.8 times. However, in order to appreciate the scale of the reduction, note that the installed costs of residential systems in 2017 are at about the same level as utility scale in 2012 or 2013 – a 4-year lag. Commercial costs are less than 2 years behind utility-scale costs. It only took a couple of years for the cost structure of residential and commercial systems to catch up with utility-scale systems that are orders of magnitude larger! With the efficiency due to the economy of scale up the supply chain, the economy of scale of the PV systems themselves is quickly collapsing. This opens the door for smaller, distributed solar PV systems to have a positive business case.

Installed cost reductions happened in all components of systems, including solar panels, inverters, structural and electrical components, install labor, and even customer acquisition or marketing. However, the cost reductions of solar panels were the largest ones. This was driven by Chinese solar manufacturers, who accounted for about 60% of global solar cell production in 2016.[xxi] China’s dominance in solar manufacturing does not come at the expense of quality, with seven of the top ten largest high-quality manufacturers supplying the U.S. residential market being Chinese.[xxii] Manufacturing capacity expansion increased in 2017, with China accounting for 70% of the expansion.[xxiii]

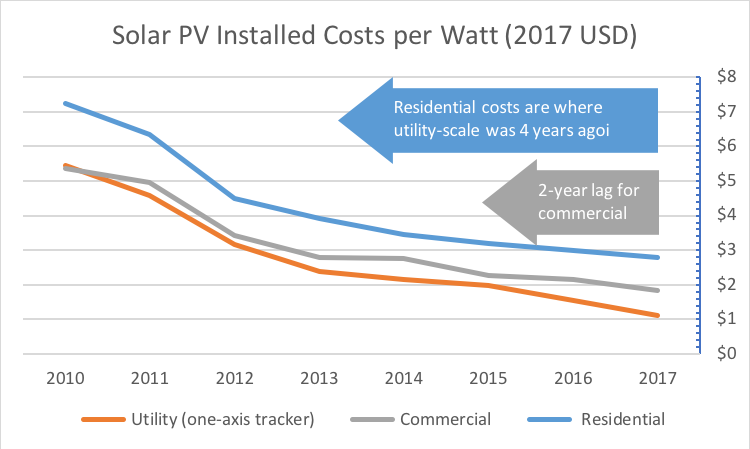
Figure 4 Installed costs of solar PV came down across all market segments in the U.S., with commercial and residential costs only 2 to 4 years behind utility scale.[xxiv]

The installed cost reduction of solar PV systems in the U.S. was partly driven by the reduction in solar PV module prices since 2010. Balance of system costs have also fallen, but not to the same extent (see Figure 5). Commercial systems are still relatively custom designs, with relatively high engineering, construction and developer overhead. Residential systems are a retail market, with higher supply chain, marketing, overhead and profit margins than the business-to-business markets. Furthermore, the cost of residential and commercial solar PV system in the U.S. is higher than many other countries. As an example, the installed costs of residential solar PV in Germany were around 37% of those in California in 2016[xxv] and the analysis suggests that there are significant opportunities to reduce the gap, if the right policies are put in place. Another study blames very high overhead in the U.S. for the high cost of residential systems.[xxvi] As the electrical code is adapted and permitting streamlined, this study suggests that residential costs will come down in the U.S.

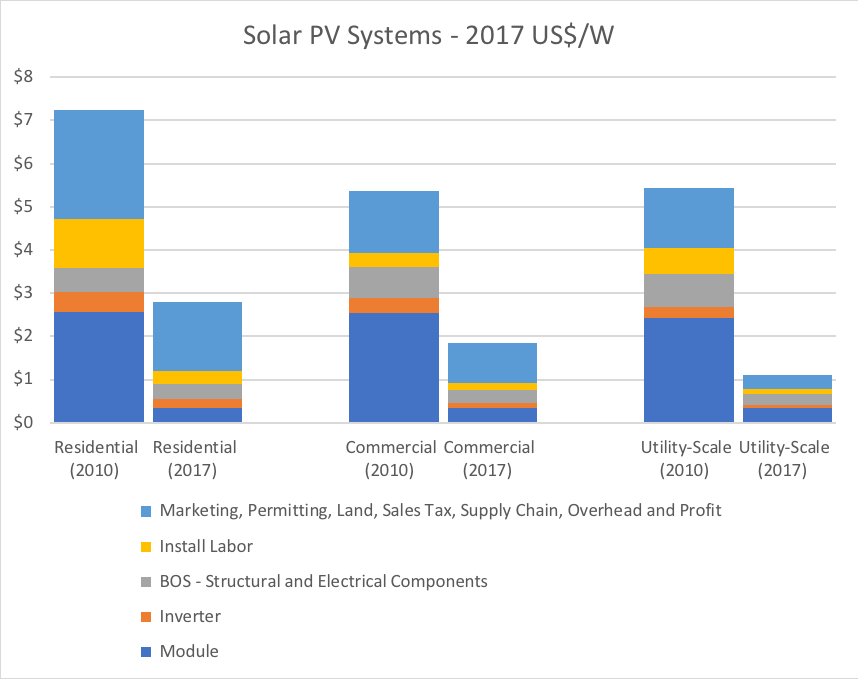
Figure 5 Installed costs of solar PV came down across all market segments in the U.S., but soft costs remain high in the residential and commercial markets.[xxvii]

Business innovations

On the backdrop of improving performance and supply chain efficiencies, business models, commercial and operating innovation are perhaps the most significant cost reduction factors for developers and operators.

First, experienced international project developers, especially from Europe and China, have developed standardized approaches to project evaluation and construction, minimizing project development risks. These firms are now looking for international opportunities as that some of their home markets are slowing. These firms are generally subsidiaries of large groups, like EDF and Shenhua (the world’s largest wind power developer), with access to low cost of capital. Chinese solar module manufacturers continue to feature strongly in overseas solar generation projects. In 2017, Chinese companies took part in projects across Asia, Latin America, Australia, and Africa. No doubt that operating in cost-sensitive and low-skill developing countries in forcing Chinese developers to innovate even more, probably with the idea to bring those innovations in developed countries later.

Second, competitive procurement get a large number of experienced medium- and large-scale developers competing to develop projects, worldwide. The relatively low barriers to entry also put smaller local players into play. The resulting purchase agreements set the price of energy for typically 20 years, adding predictability to developers’ business case, and driving costs further down than the favorable feed-in tariffs initially used in many jurisdictions (like Ontario).

Thirdly, optimized operational practices and the use of real-time and big data analytics at an increasingly granular level enable predictive maintenance to reduce ongoing costs and generation loss from downtime.[xxviii] For example, new PV panels have built-in diagnostic tools accessible remotely via monitoring software. New wind and solar farms are being designed with serviceability in mind to minimize ongoing operation and maintenance costs. Benchmarking performance and digital twins with advance analytics allow operators to identify areas of improvement. Drones do aerial thermography to identify hotspots while robots clean panels and mow grass. All these tools clearly reflect the increasing maturity of renewable power generation technologies.

[i]        http://www.forbes.com/sites/williampentland/2017/01/18/wyoming-considers-de-facto-prohibition-on-solar-and-wind-energy/, accessed 20180118.

[ii]       https://www.bloomberg.com/news/articles/2018-01-08/perry-plan-to-help-coal-nuclear-plants-rejected-by-regulators, accessed 20180118.

[iii]      International Renewable Energy Agency (IRENA), INSPIRE database, http://inspire.irena.org/Pages/patents/Patents-Search.aspx, accessed 20180121.

[iv]       Renewable Power Generation Costs in 2017, International Renewable Energy Agency, 2018, pp. 59-61.

[v]        Renewable Power Generation Costs in 2017, International Renewable Energy Agency, 2018, p. 66.

[vi]       Wind power in an open-air stream is proportional to the third power of the wind speed. Thus, a wind speed 10% higher means 33% more available power, all other things being equal.

[vii]      http://www.mbrenewables.com/en/world-record-for-energy-transition/, accessed 20180121.

[viii]     Renewable Power Generation Costs in 2017, International Renewable Energy Agency, 2018, p. 91.

[ix]       http://www.mhivestasoffshore.com/worlds-most-powerful-available-wind-turbine-gets-major-power-boost/, accessed 20180121.

[x]        https://www.reuters.com/article/us-ge-windpower-france/ge-to-develop-worlds-largest-wind-turbine-in-france-idUSKCN1GD5GW, accessed 20180310.

[xi]       General Electric, Siemens and Vestas have all roughly doubled the number of offerings in their portfolio since 2010, with each now offering over 20 models. See Renewable Power Generation Costs in 2017, International Renewable Energy Agency, 2018, p. 90.

[xii]      Renewable Power Generation Costs in 2017, International Renewable Energy Agency, 2018, pp. 102-103.

[xiii]     https://www.statoil.com/en/news/15feb2018-world-class-performance.html, accessed 20180310.

[xiv]     Renewable Power Generation Costs in 2017, International Renewable Energy Agency, 2018, pp. 42-47.

[xv]      Renewable Power Generation Costs in 2017, International Renewable Energy Agency, 2018, pp. 42-47.

[xvi]     2016 Wind Technologies Market Report: Summary, Lawrence Berkley National Laboratory, U.S. Department of Energy, p. 43.

[xvii]    http://www.investor.nexteraenergypartners.com/phoenix.zhtml?c=253465&p=earningsRelease, accessed 20180130.

[xviii]   2016 Wind Technologies Market Report: Summary, Lawrence Berkley National Laboratory, U.S. Department of Energy, p. 18.

[xix]     Globally, Vestas, GE, and Goldwind were the top suppliers in 2016, with Chinese suppliers however occupying 4 of the top 10 spots in the global ranking, based almost entirely on sales within their domestic market.

[xx]      https://www.eia.gov/todayinenergy/detail.php?id=33632, accessed 20180202.

[xxi]     IEA Renewables 2017: Analysis and Forecasts to 2022.

[xxii]    http://news.energysage.com/best-solar-panel-manufacturers-usa/, accessed ???.

[xxiii]   China 2017 Review, Institute for Energy Economics and Financial Analysis (IFEEA), p. 3.

[xxiv]    U.S. Solar Photovoltaic System Cost Benchmark: Q1 2017, National Renewable Energy Laboratory, Figures ES-1.

[xxv]     The Power to Change: Solar and Wind Cost Reduction Potential to 2025, International Renewable Energy Agency, 2016, p. 11.

[xxvi]    https://www.greentechmedia.com/articles/read/how-to-halve-the-cost-of-residential-solar-in-the-us?utm_source=Solar&utm_medium=email&utm_campaign=GTMSolar#gs.UscExbA, accessed 20180131. This study shows that the cost per watt in US$3.25 in the US and US$1.34 in Australia.

[xxvii]   U.S. Solar Photovoltaic System Cost Benchmark: Q1 2017, National Renewable Energy Laboratory, Figures ES-1.

[xxviii] https://www.bloomberg.com/news/articles/2018-01-12/buffett-s-squeezing-more-power-out-of-wind-with-this-software, accessed 20180120.

CEA Tigers’ Den Workshop

On February 21, 2018, I presented at the annual T&D Corporate Sponsors meeting of the Canadian Electricity Association. This year, the formula what similar to the “dragons” TV program, with presenters facing “tigers” from utilities. They asked me to go first, so I didn’t know what to expect, but it went well. Or, at least, the tigers didn’t eat me alive.

The theme was a continuation of my 2017 presentation, this time focusing on what changes utilities need to effect at a time of low-cost renewable energy.

I’ve attached the presentation, which was again largely hand-drawn: CEA 20180221 BMarcoux.

The Sun for a Penny

I recently presented at the Canadian Electricity Association (CEA) on the future of the industry. What would happen to the power industry if the cost to generate solar electricity reached 1¢/kWh? What could be the impact of a carbon tax? What are the business opportunities arising from the need for reliable power? While electric utilities have seen tremendous transitions during the 125-year history of the CEA, the current rate of development is unprecedented. To paraphrase a famous quote by Wayne Gretzky, utilities need to “skate to where the puck is going to be, not where it has been.” This presentation tried to provide power utilities with some insights into the future direction of the puck! See the presentation here: The Sun for a Penny 20170225a

Using Analytics to Assess Station Thermal Risks Caused by Reverse Power Flow

With sufficient Distributed Generation (DG – embedded generation in Europe) installed on the feeders of a substation, reverse power flow may occur at the station when load is low. This is especially the case when large generators (such as wind farms) are connected on express feeders dedicated to their use.

Substations have been designed, rated and operated as step-down substation with power flowing from higher system voltage to lower system voltage. Some substation transformers also have dual secondary winding transformers that do not allow for reverse power flow conditions, as unequal reverse flow in the two secondary windings would cause overheating and potential failure of the transformer.

Utilities limit DG capacity downstream of a station to avoid excessive reverse-flow and to prevent overheating of substation transformers. For example, Hydro One requires that generation shall not exceed 60% of the maximum MVA rating of a single transformer plus minimum station load.

The (worst-case) engineering assumption is that maximum generation coincides with lowest load at a station. Is it the case? Some years ago, I ran a Monte-Carlo simulation between load and wind generation, based on theoretical distribution of both, but doubling the generation normally allowed. It found that generation would be excessive… less than 2% of the time (and not by much, and at a time when load is low and so are prices). Using actual smart meter data, it is now possible to actually know what is going on and better assess risks. For solar generation in hot climates, there is a negative correlation between load and generation – in other words, maximum generation does not happen in times of minimum load.

Even better: correlating with forecast weather data can assess whether reverse flow could be excessive in a few hours, and require large DGs to go off-line ahead of a problem (and this would not happen frequently). While I have not seen such an application, it is clearly in the realm of possibilities.

Deep analytics, used as a planning tool or in support of operations, enables safe integration of more distributed integration by managing thermal limit of station transformers operating in reverse flow.

Using Analytics to Assess Islanding Risks of Distributed Generators

One of the most critical situations with Distributed Generators (DG – embedded generators in Europe) is that a interrupter on a distribution feeder may trip to isolate a circuit section and the DGs might continue supplying the load on that section, creating an “island”. When load closely match generation in the island, it may be sustained for some time, posing safety hazards – this is known to have caused death.

Distributed generators have various passive or active anti-islanding mechanisms that open a breaker at the point of connection when an islanding condition is detected. However, islanding detection techniques used in small DGs (such as residential photovoltaic generators) are far from perfect – without expensive circuitry, they may not always immediately detect an island when generation and load are closely matched. Therefore, some utilities require that load on any feeder section (i.e., between interrupters) be always greater than generation, ensuring that an island cannot sustain itself. This means that the total distributed generation capacity on a feeder section must be significantly less than the minimum aggregated load on that section. The problem is compounded by the fact the engineers assessing DG connection requests usually do not know actual load and generation per line section – estimations need to be made.

In the end, allowable distributed generation on a line section can be a pretty small number – in Ontario, Hydro One requires that total generation must not exceed 7% of the annual line section peak load – meaning that few customers are allowed to have generators.

Applying analytics on smart meter data can better assess how much distributed generation can safely be connected to a line section. For instance, minimum load may never be correlated with maximum generation – e.g., in hot climates, minimum load occurs at night, when there is no solar generation. Analytics can look into past load and generation records to determine how much generation can be connected without getting into potential islanding condition. Safe generation levels may be many times more than the previous conservative worst-case-that-never-happens engineering guidelines allowed.

Better DG Connection Assessment by Validating Phase Mapping and Tap Settings with Utilities Analytics

Distributed generators (DG – embedded generators in Europe) can cause voltage excursions outside the allowable range and can exacerbate phase imbalance, increasing losses (especially on North American networks). Utilities set engineering rules to try to mitigate those effects, for example by limiting how much generation can be connected per feeder section.

Unfortunately, meter-to-transformer-to-phase (MTP) mapping (MPT in Europe) is notoriously inaccurate, meaning that engineers do not know the distribution of single-phase DGs on a feeder – with DGs often clustered on single-phase laterals, DG dispersal across phases may be far from even. Similarly, distribution transformer tap positions are generally unknown, but often set high because under-voltages was the traditional problem – with DGs, over-voltage can become the issue. This forces engineers to take an overly cautious approach when assessing DG connections or face the risk of network problem later.

In the past, validating MTP mapping and distribution tap settings required extensive fieldwork to track each triplex to a transformer, to track the transformer to a phase, and to visually check tap setting with a bucket truck. Now, analytic applications can correlate voltage levels over time to identify to what transformers and phase each meter belongs, and identify transformers where tap setting is too high or too low. The analytical engine can also correlate service point street address and longitude/latitude coordinates with those of the transformer. The correlations are statistical, but, with enough historical data, the accuracy is equal to or better than a visual survey, at a much-reduced cost.

With reliable phase and tap information, engineers can now assess DG connections requests with greater confidence that voltage stability of the grid will be maintained.