Il est écrit dans le contexte d’un pays de plus en plus dysfonctionnel, où les institutions qui permettaient autrefois de réaliser de grands projets sont aujourd’hui contestées, fragilisées ou activement démantelées. Les auteurs cherchent à expliquer comment un système qui a construit le réseau autoroutier national, le programme Apollo et l’écosystème moderne de recherche a perdu sa capacité à livrer.
Le Canada et le Québec ne se trouvent pas dans cette situation.
Nos institutions sont imparfaites, mais elles fonctionnent. Les services publics opèrent. Les organismes de réglementation font leur travail. Les gouvernements conservent un niveau minimal de légitimité. Cela ne se traduit toutefois pas automatiquement par une capacité d’exécution élevée. En pratique, il est souvent plus facile de construire dans des endroits comme le Texas qu’au Québec. La contradiction est réelle : des institutions fonctionnelles peuvent produire des résultats lents lorsque les processus s’accumulent, que les mandats se chevauchent et que les décisions sont séquentielles plutôt qu’intégrées. C’est dans ce contexte qu’il faut lire ce livre.
Et pourtant, plusieurs de ses idées centrales s’appliquent.
La contrainte n’est plus la ressource, mais l’exécution
L’argument central de Abundance est que les économies avancées ne sont plus limitées par un manque d’idées, de capital ou de technologies, mais par leur capacité à exécuter.
La rareté est aujourd’hui souvent institutionnelle.
Non pas parce que nous ne pouvons pas construire, mais parce que nous ne le faisons pas.
Au Canada, cela se manifeste par des délais de projets prolongés, des coûts d’infrastructure en hausse et une friction réglementaire cumulative. En énergie, cela se traduit par des retards dans le transport, la production et le développement des ressources. Le problème n’est pas technique. Il est organisationnel.
Capacité de l’État, et non taille de l’État
Une des contributions les plus utiles du livre est la distinction entre la taille de l’État et sa capacité.
La question n’est pas de savoir si l’État est grand ou petit, mais s’il est capable d’atteindre ses objectifs.
Le Québec dispose déjà d’une forte présence de l’État, notamment en énergie. Hydro Québec en est un exemple clair. Mais même là, l’exécution devient plus difficile à la marge, ce qui pourrait devenir un frein à la transition énergétique.
L’enjeu n’est pas d’ajouter des politiques. Il est de s’assurer que les institutions existantes livrent des résultats.
Le dilemme vert, version canadienne
L’une des sections les plus pertinentes du livre est le «?Green Dilemma?» : des cadres environnementaux conçus pour bloquer des projets nuisibles bloquent désormais aussi des projets bénéfiques.
C’est directement applicable au Canada.
Des régimes réglementaires conçus pour encadrer les industries polluantes et les hydrocarbures sont maintenant appliqués, souvent sans adaptation, aux énergies renouvelables, aux infrastructures de transport et aux minéraux critiques. Au Québec, le BAPE (Bureau d’audiences publiques sur l’environnement) tend de plus en plus à agir comme un mécanisme d’arrêt de projets, parfois perçu comme un «?Bureau d’arrêt des projets électriques?».
Le résultat est contre-productif.
Des projets essentiels à la décarbonation sont soumis aux mêmes contraintes que ceux qu’ils doivent remplacer. Cela ralentit la transition énergétique.
Friction institutionnelle, réalité canadienne
Au Canada, le problème tient moins à une judiciarisation excessive comme aux États-Unis qu’à une accumulation de frictions institutionnelles.
La multiplicité des niveaux de gouvernance, les mandats qui se chevauchent et les processus d’approbation séquentiels créent des délais et de l’incertitude. À cela s’ajoute le fait que l’énergie est réglementée de manière indépendante dans chaque province, avec des cadres et des priorités distincts.
Le résultat est un système fragmenté où les projets interjuridictionnels deviennent plus complexes.
L’effet est similaire à celui décrit dans le livre : délais plus longs, coûts plus élevés et capacité d’exécution réduite. Mais le mécanisme est différent.
La dimension manquante : la capacité industrielle
La principale faiblesse du livre est l’absence d’analyse des chaînes d’approvisionnement et de la capacité industrielle.
Il suppose que si les obstacles sont levés, les projets suivront.
Ce n’est plus le cas.
Dans l’énergie et les infrastructures, les contraintes incluent désormais la disponibilité des équipements, la main-d’œuvre et la capacité manufacturière.
C’est ici que le Canada et le Québec disposent d’une opportunité.
Contrairement aux hydrocarbures, qui dépendent de la géologie, plusieurs composantes de la transition énergétique peuvent être fabriquées. Avec des politiques industrielles adaptées, cette capacité peut être développée localement.
Que retenir de Abundance
Abundance offre un diagnostic pertinent : les économies avancées ont perdu leur aptitude à construire.
Pour le Québec et le Canada, l’enjeu n’est pas de reproduire le débat américain, mais d’agir avant de converger vers les mêmes blocages.
Trois priorités se dégagent : améliorer l’exécution, adapter les cadres réglementaires à la transition énergétique et développer la capacité industrielle.
Le risque n’est pas un manque d’idées.
C’est de ne plus être capables de les concrétiser.
It is written against the backdrop of a country that is increasingly dysfunctional, where institutions that once enabled large-scale execution are now contested, weakened, or actively dismantled. The authors are trying to explain how a system that once built the interstate highway network, the Apollo program, and the modern research ecosystem has lost its ability to deliver.
Canada, and Québec in particular, are not in that situation.
Our institutions are imperfect, but they are functioning. Public utilities work. Regulatory bodies operate. Governments retain a baseline level of legitimacy. Yet this does not automatically translate into ease of execution. In practice, it is often easier to build in places like Texas than in Québec. The apparent contradiction is real: functioning institutions can still produce slow outcomes when processes accumulate, mandates overlap, and decisions are sequenced rather than integrated. That difference should frame how we read the book.
And yet, many of the book’s core insights still apply.
The real constraint is no longer resources, but execution
The central argument of Abundance is that advanced economies are no longer constrained by a lack of ideas, capital, or technology. They are constrained by their ability to execute.
Scarcity today is often institutional.
Not because we cannot build, but because we do not.
This is visible in Canada through long project timelines, rising infrastructure costs, and cumulative regulatory friction. In energy, it shows up in delays in transmission, generation, and resource development. The issue is not engineering capability. It is coordination, sequencing, and decision-making.
State capacity, not state size
One of the book’s most useful clarifications is the distinction between state size and state capacity.
The question is not whether the government is large or small. It is whether it can achieve its objectives.
Québec already has a significant state presence, particularly in energy. Hydro Québec is a clear example of strong institutional capability. But even there, execution is becoming harder at the margin, and this may become a bottleneck for the energy transition.
The issue is not adding more policy. It is ensuring that existing institutions can deliver outcomes.
The green dilemma, Canadian version
One of the strongest sections of the book is the “Green Dilemma”: environmental frameworks designed to stop harmful projects are now also stopping beneficial ones.
This applies directly to Canada.
Regulatory regimes built to constrain polluting and oil and gas industries are now being applied, often with little adaptation, to renewable energy, transmission infrastructure, and critical mineral development. In Québec, the BAPE (Bureau d’audiences publiques sur l’environnement, or Public Hearings Office on the Environment) increasingly functions as a de facto project stopper, and could be referred to as a “Bureau d’arrêt des projets électriques.”
The result is counterproductive.
Projects that are essential to decarbonization face the same procedural burden as those they are meant to replace. This slows the energy transition and is not aligned with environmental objectives.
Institutional friction, Canadian reality
The Canadian issue is less about excessive lawyering, like in the US, and more about accumulated institutional friction.
Multiple layers of governance, overlapping mandates, and sequential approval processes create delays and uncertainty. This is compounded by the fact that energy is regulated independently in each province, with distinct frameworks, priorities, and approval processes.
The result is a fragmented system where projects that span jurisdictions, such as transmission or supply chains, face additional coordination challenges.
The effect is similar to what the book describes: longer timelines, higher costs, and reduced execution capacity. But the mechanism is different, and so are the solutions.
The missing dimension: industrial capacity
Where the book is weakest are supply chains and industrial capacity.
It largely assumes that once barriers are removed, projects can proceed.
That is increasingly false.
In energy and infrastructure, constraints now include equipment availability, skilled labour, and manufacturing capacity.
This is where Canada and Québec have a structural opportunity.
Unlike fossil fuels, which depend on geology, many components of the energy transition can be manufactured. With the right industrial policies, capacity can be built locally. This is a strategic lever that the book largely ignores.
What to take from Abundance
Abundance is a sharp diagnosis of a real problem: advanced economies have become less capable of building.
For Québec and Canada, the lesson is not to replicate the U.S. debate, but to act before we converge toward the same dysfunction.
The priorities are clear: focus on execution rather than additional planning, adapt regulatory frameworks to the realities of the energy transition, and build industrial capacity alongside infrastructure.
The risk is not that we lack ideas.
It is that we become progressively less able to turn them into reality.
Two weeks into the Iran war, the immediate military and diplomatic stakes are obvious. But the most important long?term consequence may be a faster energy transition. The longer the crisis lasts, the more pressure there will be for a faster transition.
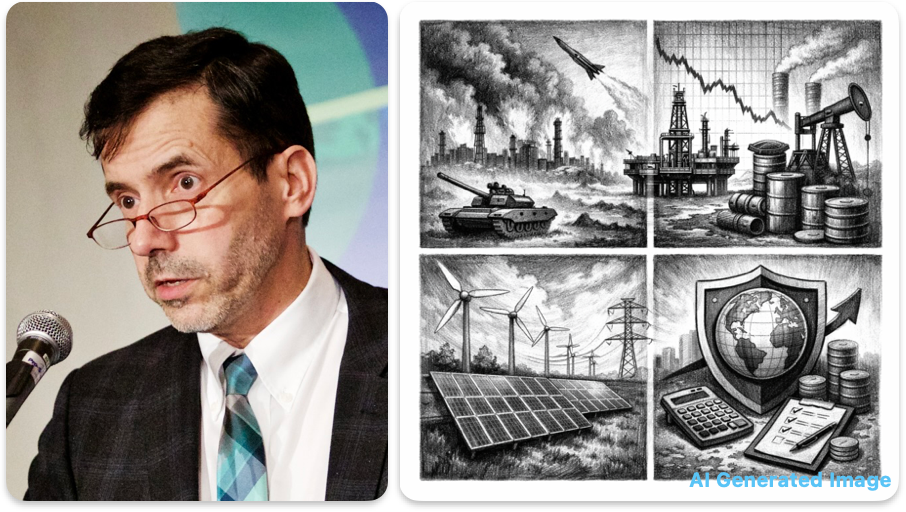
Oil and gas markets react instantly to geopolitical shocks. Tankers, pipelines and maritime choke points such as Hormuz make fossil fuels inherently exposed to conflict. Each crisis reminds governments and businesses of a simple reality: fuel?based energy systems depend on fragile global supply chains. This exposes countries to the political peril of being at the mercy of unpredictable or adventurous administrations in major exporting states or security alliances.
Electric systems based on solar, wind, batteries and, where available, hydro work differently. The equipment may be imported, but the energy itself is local. With the right industrial policies, much of this infrastructure can also be manufactured domestically. Fossil fuels, by contrast, depend on geology. They cannot be manufactured and must be extracted where the resource happens to exist.
Even when solar panels or battery cells are imported, they represent only part of the overall cost of the system. In solar and battery storage projects, a majority share of the investment lies in the balance of system, installation, grid connection and integration, which are local activities. Unlike fossil fuels, where much of the economic value leaves the country with every shipment of oil or gas, these projects generate a substantial share of their economic impact locally through engineering, construction and electrical infrastructure.
This distinction between fuel flows and energy infrastructure may prove decisive.
Signs the Fossil System May Be Nearing an Inflection Point
Recent developments suggest the global fossil system may already be closer to its structural peak than many assume.
Consider China, which has been the main engine of oil demand growth for two decades. A large share of recent “demand” has actually been stock building. Estimates suggest that roughly one million barrels per day of crude had been going into strategic reserves rather than final consumption before the Iran war.
At the same time, most remaining demand growth in China now comes from petrochemical feedstocks. Fuel demand itself appears to have largely plateaued, which reduces the exposure of China to the Iran war.
On the supply side, U.S. shale no longer looks like an endlessly expanding source of production. Output remains high, but growth has slowed significantly and several analysts see signs that the easy expansion phase may be nearing its limits.
Meanwhile, a different pattern is emerging in parts of Africa and South Asia. Where electricity grids are weak and imported fuels expensive, solar, batteries and electric two? and three?wheel vehicles are spreading quickly. These systems often prove cheaper and more resilient than fuel?based alternatives.
None of this means fossil fuels are about to disappear. Phasing them out will take time and the global economy will rely on them for years. But reducing exposure to their price volatility and geopolitical risk is increasingly becoming a sensible risk?management strategy for many countries.
The key moment in any industrial transition is when demand stops growing and begins a structural decline.
Once that point is reached, the dynamics of an industrial change. Investors become cautious about financing long?lived fossil projects. Electrified technologies continue to fall in cost as manufacturing scales. Each EV, heat pump or solar installation permanently removes part of fossil demand.
Industrial transitions thus often speed up after the peak.
What China and Europe Appear to Have Understood About Energy Security and Choke Points
China and several European countries already appear to be operating with this logic.
China has aggressively deployed solar, batteries and electric vehicles while building strategic oil reserves to manage short?term supply risk. At the same time, it has invested heavily across the supply chains for solar, batteries and critical minerals, seeking not only to power its own economy but also to control key choke points in the emerging global energy system.
Many European countries, after the shock of Russian gas dependency, are accelerating electrification and renewable deployment precisely to reduce exposure to fossil fuel geopolitics.
In both cases, the strategy is similar: manage near?term fossil dependence while reducing long?term exposure.
China’s growing petrochemical sector also values heavy crude streams as feedstock, a reminder that, even in a declining fuel market, some types of oil may retain strategic value as industrial carbon sources. This point is particularly relevant for countries such as Canada that produce heavy crude, including oil sands.
Implications for Canada and Québec
For countries such as Canada, and for Québec in particular, the implications are somewhat different.
Fossil fuels will remain part of the global energy system for years, and demand will not disappear overnight. Managing this transition therefore requires careful risk management.
Three principles matter in particular.
First, the declining fossil demand must be managed pragmatically during the transition. Abrupt disruption would be economically damaging.
Second, governments should be cautious about funding long?lived infrastructure that could become stranded if global fossil demand eventually declines. Public policy should avoid transferring that risk to taxpayers or electricity customers.
Third, accelerating electricity infrastructure carries relatively little downside in a world where electricity demand is already expected to grow. Electrification of transport, heating and industry will require major grid expansion and generation capacity in any case. Moving faster on electricity systems therefore reduces exposure to fossil volatility while supporting infrastructure that will be needed regardless of how quickly the transition unfolds.
In other words, the transition is not only about replacing energy sources. It is also about managing risk in a period of structural change.
From Energy Transition to Risk Management
Conflicts in the Gulf will not end the fossil era. But repeated geopolitical shocks can change expectations. Once markets begin behaving as if fossil demand has peaked, the system tends to move in one direction.
The deeper transition is not simply from fossil fuels to renewables.
Pourquoi cette guerre compte au?delà du Moyen?Orient
Deux semaines après le début de la guerre en Iran, les enjeux militaires et diplomatiques immédiats sont évidents. Mais la conséquence la plus importante à long terme pourrait se situer dans le système énergétique. Plus la crise durera, plus la pression pour accélérer la transition énergétique sera forte.
Les marchés du pétrole et du gaz réagissent instantanément aux chocs géopolitiques. Les pétroliers, les pipelines et les goulets d’étranglement maritimes, comme Ormuz, rendent les combustibles fossiles intrinsèquement exposés aux conflits. Chaque crise rappelle aux gouvernements et aux entreprises une réalité simple : les systèmes énergétiques fondés sur les carburants reposent sur des chaînes d’approvisionnement mondiales fragiles. Cela expose les pays au risque politique de dépendre d’administrations imprévisibles ou aventureuses dans les grands pays exportateurs ou dans les alliances de sécurité.
Les systèmes électriques fondés sur le solaire, l’éolien, les batteries et, lorsque c’est possible, l’hydroélectricité fonctionnent différemment. Les équipements peuvent être importés, mais l’énergie elle?même est locale. Avec les bonnes politiques industrielles, une grande partie de cette infrastructure peut aussi être fabriquée localement. Les combustibles fossiles, en revanche, dépendent de la géologie. On ne peut pas les fabriquer : ils doivent être extraits là où la ressource existe.
Même lorsque les panneaux solaires ou les cellules de batterie sont importés, ils ne représentent qu’une partie du coût total du système. Dans les projets solaires et de stockage par batteries, la plus grande part de l’investissement concerne le reste du système, l’installation, le raccordement au réseau et l’intégration, qui sont des activités locales. Contrairement aux combustibles fossiles, où une grande partie de la valeur économique quitte le pays avec chaque cargaison de pétrole ou de gaz, ces projets génèrent une part importante de leurs retombées économiques localement, par l’ingénierie, la construction et les infrastructures électriques.
Cette distinction entre flux de carburants et infrastructures énergétiques pourrait s’avérer déterminante.
Signes que le système fossile approche peut?être d’un point d’inflexion
Les développements récents suggèrent que le système fossile mondial pourrait déjà être plus proche de son sommet structurel qu’on ne le pense.
Prenons le cas de la Chine, qui a été le principal moteur de la croissance de la demande pétrolière pendant deux décennies. Une grande partie de la «?demande?» récente correspond en réalité à du stockage stratégique. On estime qu’environ un million de barils par jour de pétrole brut étaient dirigés vers les réserves stratégiques plutôt que vers la consommation finale avant la guerre en Iran.
Dans le même temps, la majeure partie de la croissance restante de la demande en Chine provient désormais des matières premières pétrochimiques. La demande de carburants semble avoir largement plafonné, ce qui réduit l’exposition de la Chine à la guerre en Iran.
Du côté de l’offre, la production de pétrole de schiste aux États?Unis ne ressemble plus à une source de croissance illimitée. La production reste élevée, mais sa croissance a nettement ralenti et plusieurs analystes estiment que la phase d’expansion facile pourrait approcher de ses limites.
Pendant ce temps, un autre modèle émerge dans certaines régions d’Afrique et d’Asie du Sud. Là où les réseaux électriques sont faibles et les carburants importés coûteux, le solaire, les batteries et les véhicules électriques à deux ou trois roues se diffusent rapidement. Ces solutions s’avèrent souvent moins coûteuses et plus résilientes que les systèmes fondés sur les carburants.
Rien de tout cela ne signifie que les combustibles fossiles sont sur le point de disparaître. Leur élimination prendra du temps et l’économie mondiale en dépendra encore pendant des années. Mais réduire l’exposition à leur volatilité de prix et aux risques géopolitiques devient de plus en plus une stratégie de gestion du risque pour de nombreux pays.
Le moment clé dans toute transition industrielle survient lorsque la demande cesse de croître et commence à décliner structurellement.
Une fois ce point atteint, la dynamique industrielle change. Les investisseurs deviennent plus prudents à l’égard des projets fossiles de longue durée. Les technologies électrifiées continuent de baisser en coût à mesure que la production industrielle augmente. Chaque véhicule électrique, pompe à chaleur ou installation solaire retire durablement une part de la demande fossile.
Les transitions industrielles s’accélèrent souvent après ce point.
Ce que la Chine et l’Europe semblent avoir compris à propos de la sécurité énergétique et des points de contrôle
La Chine et plusieurs pays européens semblent déjà agir selon cette logique.
La Chine a massivement déployé le solaire, les batteries et les véhicules électriques tout en constituant des réserves stratégiques de pétrole afin de gérer les risques d’approvisionnement à court terme. En parallèle, elle a investi fortement dans les chaînes d’approvisionnement du solaire, des batteries et des minéraux critiques, cherchant non seulement à alimenter sa propre économie, mais aussi à contrôler des points de passage clés dans le futur système énergétique mondial.
Après le choc de la dépendance au gaz russe, de nombreux pays européens accélèrent l’électrification et le déploiement des énergies renouvelables précisément pour réduire leur exposition à la géopolitique des combustibles fossiles.
Dans les deux cas, la stratégie est similaire : gérer la dépendance fossile à court terme tout en réduisant l’exposition à long terme.
Le secteur pétrochimique croissant de la Chine valorise également les pétroles lourds comme matière première, rappelant que même dans un marché des carburants en déclin, certains types de pétrole peuvent conserver une valeur stratégique comme sources de carbone industriel. Ce point est particulièrement pertinent pour des pays, comme le Canada, qui produisent du pétrole lourd, notamment les sables bitumineux.
Implications pour le Canada et le Québec
Pour des pays comme le Canada, et pour le Québec en particulier, les implications sont quelque peu différentes.
Les combustibles fossiles resteront une composante du système énergétique mondial pendant encore plusieurs années et la demande ne disparaîtra pas du jour au lendemain. Gérer cette transition exige donc une gestion prudente du risque.
Trois principes sont particulièrement importants.
Premièrement, la baisse de la demande fossile doit être gérée de façon pragmatique pendant la transition. Une perturbation brutale serait économiquement dommageable.
Deuxièmement, les gouvernements devraient être prudents avant de financer des infrastructures de longue durée qui pourraient devenir des actifs échoués si la demande mondiale de combustibles fossiles diminue. Les politiques publiques devraient éviter de transférer ce risque aux contribuables ou aux consommateurs d’électricité.
Troisièmement, accélérer les infrastructures électriques comporte relativement peu de risques dans un monde où la demande d’électricité est déjà appelée à croître. L’électrification des transports, du chauffage et de l’industrie nécessitera de toute façon une expansion majeure des réseaux et des capacités de production. Aller plus vite dans le développement des systèmes électriques réduit donc l’exposition à la volatilité des combustibles fossiles tout en soutenant des infrastructures qui seront nécessaires, quelle que soit la vitesse de la transition.
Autrement dit, la transition ne consiste pas seulement à remplacer des sources d’énergie. Il s’agit aussi de gérer les risques dans une période de transformation structurelle.
De la transition énergétique à la gestion du risque
Les conflits dans le Golfe ne mettront pas fin à l’ère des combustibles fossiles. Mais des chocs géopolitiques répétés peuvent modifier les attentes. Une fois que les marchés commencent à agir comme si la demande fossile avait atteint son sommet, le système tend à évoluer dans une seule direction.
La transition la plus profonde n’est pas simplement celle qui mène des combustibles fossiles aux renouvelables.
C’est celle qui mène de carburants mondiaux vers une électricité locale.
Throughout my career, first as an engineer and later as a strategy consultant, I have worked with organizations facing major transitions. The liberalization of telecommunications, the shift from analogue to digital, and the emergence of the internet and mobile technologies fundamentally redefined business models that had once seemed stable.
Today, the energy sector is undergoing a transformation of a comparable magnitude.
Traditional strategic planning rests on an implicit assumption: predictability. Past trends serve as a guide. Models converge toward a central scenario. Sensitivity analyses test variations around known variables.
This logic works reasonably well in environments that evolve slowly.
During an industrial transition, it becomes misleading.
The energy transition combines rapid technological evolution, deep regulatory change, persistent geopolitical instability, the physical impacts of climate change, and potential disruptions capable of reshaping value chains. Investment decisions are capital-intensive, time horizons are long, and mistakes can be costly.
In this context, the strategic question is no longer “What is the most probable scenario?” but rather, “How do we execute a plan capable of absorbing major bifurcations without losing coherence?”
Here is the overall logic I propose.
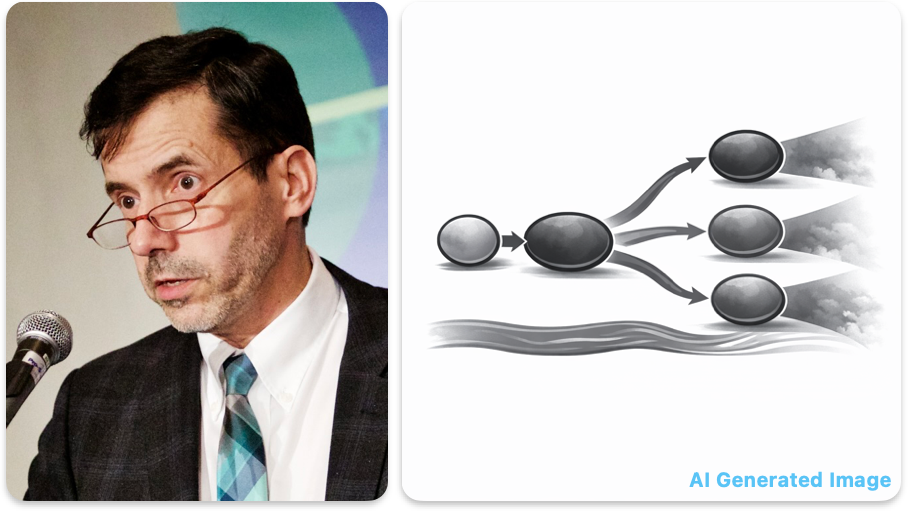
The diagram condenses the approach: an initial diagnosis, possible events, plausible bifurcations, cones of uncertainty, and actions that influence probability and impact. It helps visualize the shift from a static snapshot to a set of possible trajectories, each surrounded by a zone of uncertainty and shaped by concrete decisions.
1. Start with a structured diagnosis
For simplicity, let us use the SWOT analysis framework (Strengths, Weaknesses, Opportunities, Threats).
Strengths are current internal elements that provide a recognized comparative advantage.
Weaknesses are internal elements that limit performance but can be corrected.
Opportunities are realistic avenues for progress built on an existing functional base. They can be developed or captured.
Threats are external or systemic developments that may cause harm. They cannot be directly controlled, but the response can be managed.
The SWOT analysis provides a structured snapshot. It distinguishes the internal from the external, what works well from what does not. But it remains static. It does not yet identify what is decisive.
In energy, this diagnosis may concern positioning within value chains, dependence on critical inputs, security of fuel supply where relevant, the robustness of generation and distribution infrastructure, technological adaptability, or financial resilience.
In periods of transition, one variable becomes central: adaptive capacity. Strength can turn into rigidity if it locks the organization into an outdated model. A weakness can be corrected if identified early and addressed with discipline.
2. Project forward: what could happen?
The next step is to translate opportunities and threats into concrete events that could materialize.
We move from snapshot to anticipation.
Each event is assessed along two simple dimensions:
Its probability.
Its impact.
This logic applies symmetrically to adverse and favourable developments.
A threat becomes an evaluated risk. An opportunity becomes a strategic possibility analyzed with equal rigour.
The objective is not to produce an elegant matrix. It is to identify the events capable of genuinely altering the trajectory.
An event with a low probability but high impact may be structurally significant. Conversely, a frequent event with limited impact belongs to routine management.
This is where dominant variables emerge.
3. From dominant variables to strategic bifurcations
Scenarios are not invented to explore imagination. They correspond to bifurcations linked to structurally significant variables.
One can distinguish a central scenario and a limited number of alternative scenarios associated with the materialization of a major risk or a significant breakthrough.
Planning becomes an exercise in clarifying bifurcations, not multiplying scenarios.
4. Acting on probability and impact
Once dominant variables are identified, the strategy becomes operational.
For each risk and each opportunity, two categories of action can be distinguished.
First category: act on probability. For a risk, this may involve diversifying markets, reducing critical dependencies, or strengthening alliances. For an opportunity, it may involve investing in research and development, launching pilot projects, or forming industrial partnerships.
Second category: act on impact. For a risk, this may require increasing operational flexibility, redundancy, or absorption capacity. For an opportunity, it may mean amplifying positive effects, for example, by reserving industrial capacity or securing market access.
The strategy thus materializes as a portfolio of concrete options.
An option is an activity undertaken today to influence the probability or impact of an event tomorrow, while preserving the freedom to decide later whether to fully commit. It may involve preparatory investments, partnerships, capability building, regulatory positioning, or pilot projects.
Crucially, an option does not oblige execution. It creates the right, not the obligation, to act. Some options will expire unused. Some preparatory efforts may appear wasted in hindsight. That is not a failure of strategy; it is the price of flexibility in a period of structural uncertainty.
5. Testing robustness: the cone of possibilities
Within a given scenario, sensitivity analysis tests the robustness of decisions.
Key assumptions are varied around a defined trajectory: capital expenditure, cost of capital, energy prices, timelines.
These variations define a cone of possibilities.
A robust decision is one that remains coherent within that cone.
It must be recognized, however, that classical sensitivities operate on known variables. They do not always capture structural disruptions. This is why identifying dominant variables and plausible bifurcations upstream is critical.
One essential point deserves emphasis: this approach remains relevant even if we do not anticipate exactly which events ultimately materialize. Actions undertaken to influence probability or impact are often reusable across different situations. Diversifying markets, developing capabilities, strengthening operational flexibility, or building strategic partnerships increases resilience to a wide range of shocks. The objective is therefore not to predict the future precisely, but to prepare for the unpredictable.
6. An evolving process
Strategic planning in a period of transition is not a one-time exercise.
By repeating the analysis regularly, some bifurcations may disappear while others emerge. Cones of possibilities may narrow or widen. The hierarchy of dominant variables may shift.
We cannot predict the future in every detail, especially in an industrial transition such as the one currently reshaping the energy sector.
But we can structure uncertainty.
Experience from previous transitions has taught me this: organizations that navigate such periods successfully are not those with the best scenario. They are those that have organized their ability to pivot.
That is when planning stops being a modelling exercise and becomes an instrument of execution.
If you look at your current strategic plan, does it truly organize your ability to pivot, or does it still assume continuity?
Au fil de ma carrière, d’abord comme ingénieur, puis comme consultant en stratégie, j’ai accompagné des organisations confrontées à des transitions majeures. La libéralisation des télécommunications, le passage de l’analogique au numérique, l’arrivée d’Internet et du mobile ont profondément redéfini des modèles d’affaires que l’on croyait stables.
Le secteur de l’énergie vit aujourd’hui une transformation d’ampleur comparable.
La planification stratégique traditionnelle repose sur une hypothèse implicite : la prévisibilité. Les tendances passées servent de guide. Les modèles convergent vers un scénario central. Les analyses de sensibilité testent des variations autour de variables connues.
Cette logique fonctionne relativement bien dans des environnements qui évoluent lentement.
Lors d’une transition industrielle, elle devient trompeuse.
La transition énergétique combine une évolution technologique rapide, des changements réglementaires profonds, une instabilité géopolitique persistante, les effets physiques des changements climatiques et des ruptures potentielles capables de redéfinir les chaînes de valeur. Les décisions d’investissement sont lourdes, les cycles sont longs et les erreurs peuvent être coûteuses.
Dans ce contexte, la question stratégique n’est plus «?quel est le scénario le plus probable???», mais plutôt «?comment exécuter un plan capable d’absorber des bifurcations majeures sans perdre sa cohérence???»
Voici la logique d’ensemble que je propose.
Le schéma condense la démarche : un diagnostic initial, des événements possibles, des bifurcations plausibles, des cônes d’incertitude et des actions qui influencent la probabilité et l’impact. Il permet de visualiser le passage d’une photographie statique à un ensemble de trajectoires possibles, chacune entourée d’une zone d’incertitude et influencée par des décisions concrètes.
1. Commencer par un diagnostic structuré
Pour simplifier, prenons le cadre FFOM (Forces, Faiblesses, Opportunités, Menaces), correspondant au SWOT en anglais.
Les forces sont des éléments internes, actuels, qui donnent un avantage comparatif reconnu.
Les faiblesses sont des éléments internes qui limitent la performance, mais qui peuvent être corrigés.
Les opportunités sont des potentiels de progrès à partir d’une base fonctionnelle. Elles peuvent être construites ou saisies.
Les menaces sont des évolutions externes ou systémiques susceptibles de nuire. On ne les contrôle pas directement, mais on peut choisir comment y réagir.
Le cadre FFOM fournit une photographie structurée. Il distingue l’interne de l’externe, ce qui est bon de ce qui l’est moins. Mais il reste statique. Il ne dit rien encore sur ce qui est déterminant.
Dans l’énergie, ce diagnostic peut concerner la position dans les chaînes de valeur, la dépendance aux intrants stratégiques, la sécurité des approvisionnements en combustibles, la robustesse des infrastructures de production et de distribution, la capacité d’adaptation technologique ou la solidité financière.
En période de transition, une variable prend une importance particulière : la capacité d’adaptation. Une force peut devenir une rigidité si elle enferme l’organisation dans un modèle dépassé. Une faiblesse peut être corrigée si elle est identifiée tôt et traitée avec discipline.
2. Se projeter vers l’avant : qu’est-ce qui pourrait arriver??
L’étape suivante consiste à transformer les opportunités et les menaces en événements concrets susceptibles de se matérialiser.
On quitte la photographie pour entrer dans l’anticipation.
Chaque événement est examiné selon deux dimensions simples :
Sa probabilité.
Son impact.
Cette logique s’applique de manière symétrique aux évolutions défavorables et favorables.
Une menace devient un risque évalué. Une opportunité devient une possibilité stratégique analysée avec la même rigueur.
L’objectif n’est pas de produire une matrice élégante. Il s’agit d’identifier les événements capables de modifier réellement la trajectoire.
Un événement à faible probabilité, mais à impact élevé, peut être structurant. À l’inverse, un événement fréquent, mais d’impact limité, relève de la gestion courante.
C’est ici que se dégagent les variables dominantes.
3. Des variables dominantes aux bifurcations stratégiques
Les événements à fort impact définissent les embranchements plausibles.
Les scénarios ne sont pas inventés pour explorer l’imaginaire. Ils correspondent aux bifurcations liées aux variables structurantes.
On peut ainsi distinguer un scénario central et un nombre limité de scénarios alternatifs associés à la matérialisation d’un risque majeur ou à une percée significative.
La planification devient un exercice de clarification des bifurcations, non de multiplication de scénarios.
4. Agir sur probabilité et impact
Une fois les variables structurantes identifiées, la stratégie devient opérationnelle.
Pour chaque risque et chaque opportunité, deux catégories d’actions peuvent être distinguées.
Première catégorie : agir sur la probabilité. Pour un risque, cela peut signifier diversifier les marchés, réduire des dépendances critiques ou renforcer des alliances. Pour une opportunité, cela peut impliquer d’investir en recherche et développement, de lancer des projets pilotes ou de nouer des partenariats.
Deuxième catégorie : agir sur l’impact. Pour un risque, on cherchera à accroître la flexibilité opérationnelle, la redondance ou la capacité d’absorption. Pour une opportunité, il s’agira d’amplifier les effets positifs, par exemple en réservant des capacités industrielles ou en sécurisant l’accès aux marchés.
La stratégie se matérialise alors dans un portefeuille d’options concrètes.
Une option est une activité engagée aujourd’hui pour influencer la probabilité ou l’impact d’un événement demain, tout en conservant la liberté de décider plus tard si l’on exerce pleinement cette option. Elle peut prendre la forme d’investissements préparatoires, de partenariats, de développement de compétences, de positionnement réglementaire ou de projets pilotes.
Une option crée un droit, non une obligation. Certaines options expireront sans être exercées. Certains efforts préparatoires pourront sembler inutiles rétrospectivement. Ce n’est pas un échec stratégique, mais le prix à payer pour préserver la flexibilité dans un contexte d’incertitude structurelle.
5. Tester la robustesse : le cône de possibilités
À l’intérieur d’un scénario donné, une analyse de sensibilité permet de tester la robustesse des décisions.
On varie des hypothèses clés autour d’une trajectoire donnée : coûts d’investissement, coût du capital, prix de l’énergie, délais.
Ces variations définissent un cône de possibilités.
Une décision robuste est celle qui reste cohérente à l’intérieur de ce cône.
Il faut toutefois reconnaître que les sensibilités classiques portent sur des variables connues. Elles ne capturent pas toujours les ruptures structurelles. D’où l’importance d’avoir identifié en amont les variables dominantes et les bifurcations plausibles.
Un point essentiel mérite d’être souligné : cette approche reste pertinente, même si l’on n’anticipe pas exactement les événements qui se matérialisent. Les actions engagées pour influencer la probabilité ou l’impact sont souvent réutilisables face à des situations différentes. Diversifier des marchés, développer des compétences, renforcer la flexibilité opérationnelle ou établir des partenariats stratégiques augmente la résilience face à une variété de chocs. L’objectif n’est donc pas de prévoir précisément l’avenir, mais de se préparer à l’imprévisible.
6. Un processus évolutif
La planification stratégique en période de transition n’est pas un exercice ponctuel.
En répétant l’analyse régulièrement, certaines bifurcations disparaissent, d’autres apparaissent. Les cônes de possibilités peuvent se resserrer ou s’élargir. La hiérarchie des variables structurantes évolue.
On ne peut pas prévoir l’avenir dans tous ses détails, surtout dans une transition industrielle comme celle que traverse aujourd’hui le secteur de l’énergie.
Mais on peut structurer l’incertitude.
L’expérience des transitions précédentes m’a appris ceci : les organisations qui traversent ces périodes avec succès ne sont pas celles qui ont le meilleur scénario. Ce sont celles qui ont organisé leur capacité à bifurquer.
C’est là que la planification cesse d’être un exercice de modélisation et devient un instrument d’exécution.
Si vous regardez votre plan stratégique actuel, organise-t-il vraiment votre capacité à pivoter, ou suppose-t-il toujours la continuité??
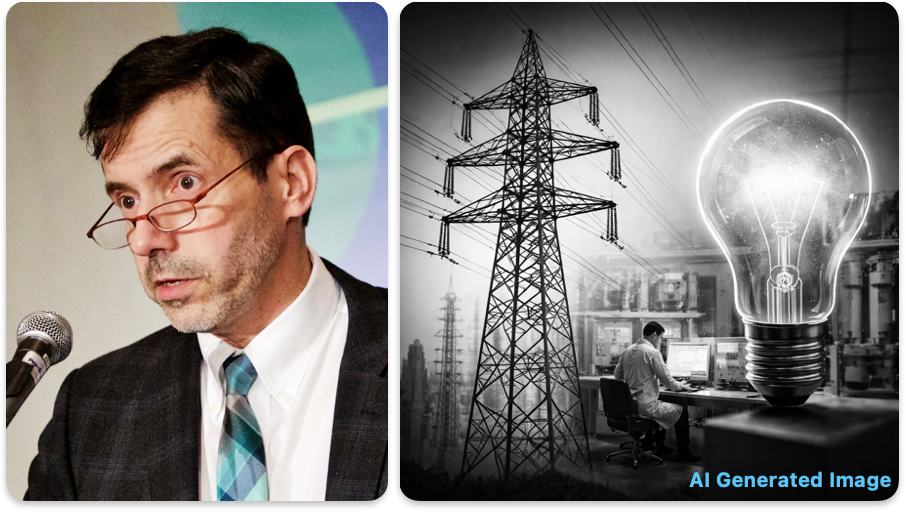
L’ouverture à l’innovation est indispensable dans le secteur de l’énergie. Mais encore faut?il être clair sur ce que recouvre réellement ce terme. Trop souvent, l’innovation est spontanément assimilée à l’invention : la percée technologique, le prototype prometteur, parfois incarnés par la figure du savant fou aux cheveux ébouriffés.
L’adoption renvoie pourtant à une réalité différente, et tout aussi déterminante. Elle ressemble moins à un acte de création qu’au travail d’un intégrateur de systèmes : il n’invente pas les composants, mais les choisit, les assemble, les fait fonctionner ensemble et en garantit la fiabilité dans le temps. Sans cette mise en œuvre disciplinée, aucune idée, même techniquement élégante, ne devient une infrastructure durable.
Cette lecture rejoint explicitement celle du Manuel d’Oslo de l’OCDE, qui précise qu’«?une innovation n’est pas seulement une idée nouvelle ou une invention. Elle doit être mise en œuvre soit directement, soit en étant fournie à des tierces parties, entreprises, individus ou organisations, qui en font usage?».
Autrement dit, comme me le faisait remarquer un ami, une innovation est une nouveauté mise en œuvre.
En pratique, le processus d’innovation est bien sûr plus riche et plus graduel. Il comprend plusieurs étapes décrites dans différents modèles, comme recherche, développement exploratoire, démonstration, industrialisation, commercialisation, et diffusion. Chacune de ces étapes mobilise des acteurs, des risques et des savoir?faire différents. Dans ce texte, je propose toutefois une simplification analytique assumée. Plutôt que de décrire l’ensemble de cette chaîne, je la ramène à deux éléments essentiels : l’invention, qui crée des options, et l’adoption, qui transforme ces options en valeur.
Dans les systèmes électriques, l’invention et l’adoption sont complémentaires, mais obéissent à des logiques distinctes et sont souvent portées par des acteurs différents. L’enjeu n’est donc pas de choisir entre invention et adoption, mais de renforcer les capacités nécessaires aux deux.
Au Canada, et au Québec en particulier, le défi n’est pas de trancher entre ces deux fonctions. Il est de les développer simultanément, en reconnaissant que chacune pose des problèmes spécifiques et appelle des réponses différentes.
L’invention et l’adoption sont complémentaires
L’invention élargit l’espace des possibles. Elle crée des options technologiques, des concepts nouveaux, des solutions potentielles. L’adoption, elle, transforme ces options en solutions réelles, intégrées au système, utilisées à grande échelle.
L’invention ouvre des portes. L’adoption décide lesquelles sont franchies durablement.
Cette relation n’est pas un ruban que l’on déroule de manière linéaire, du laboratoire vers le marché. C’est un cycle itératif : l’adoption en conditions réelles génère des données et des imprévus qui deviennent, à leur tour, la matière première de la prochaine vague d’innovation. Dans l’énergie, l’adoption n’est pas seulement la ligne d’arrivée?; elle est la boussole qui indique à l’invention où porter ses prochains efforts.
Dans le secteur de l’énergie, les blocages ne viennent donc pas uniquement d’un déficit d’invention ni uniquement d’un conservatisme institutionnel ralentissant l’adoption. Ils apparaissent lorsque l’une progresse plus vite que l’autre, ou lorsqu’on suppose que l’une peut compenser l’absence de l’autre. En d’autres termes, ce n’est ni l’invention seule ni l’adoption seule qui fait système, mais leur articulation dans le temps et dans l’espace industriel.
Ce que l’adoption révèle que l’invention ignore
Tant qu’une technologie reste marginale, elle peut sembler simple, élégante et prometteuse. C’est lorsqu’elle est déployée à grande échelle que la réalité du système apparaît.
L’adoption agit alors comme un révélateur. Elle met en évidence les contraintes physiques des réseaux, la cohabitation avec des actifs existants amortis sur des décennies, les limites des modèles d’affaires et les frictions réglementaires. Du point de vue des utilisateurs finaux — entreprises comme particuliers — elle fait aussi apparaître des coûts d’intégration, des changements de comportement, des risques opérationnels et des contraintes financières souvent sous?estimés.
L’adoption est également le moment où la technologie rencontre les usages. Une solution peut être techniquement robuste et échouer néanmoins si elle ne s’insère pas dans les pratiques existantes ou si elle ne suscite pas l’adhésion des utilisateurs. Réussir l’adoption suppose donc d’aller au?delà de la performance technique, en travaillant sur les interfaces, les incitatifs et les structures tarifaires. Il ne s’agit pas seulement d’imposer une infrastructure, mais de concevoir des usages compatibles avec le fonctionnement quotidien du système.
C’est pourquoi une technologie convaincante en laboratoire ou en projet pilote peut s’avérer décevante, coûteuse ou complexe une fois confrontée au système réel. L’échec tient rarement à sa performance intrinsèque?; il provient le plus souvent de son impact global : effets de bord sur le réseau, interactions imprévues avec d’autres équipements, complexité opérationnelle accrue ou déplacement de coûts et de risques vers d’autres acteurs. L’adoption constitue ainsi le véritable test de cohérence systémique que l’invention, à elle seule, ne peut pas passer.
Chaîne d’approvisionnement électrique : inventer et adopter sous contrainte
Pour les fournisseurs de technologies, de systèmes et pour les entreprises manufacturières du secteur électrique, l’innovation repose toujours sur une combinaison d’invention et d’adoption. Mais cette combinaison varie fortement selon le type d’acteur, la taille des entreprises et la nature des équipements concernés.
Du côté des PME, l’invention porte le plus souvent sur des briques technologiques de plus petite taille, mais à forte valeur ajoutée : systèmes de contrôle et de gestion des réseaux, solutions d’efficacité énergétique, domotique, logiciels, équipements et services pour la recharge des véhicules électriques, capteurs et automatismes. Prises isolément, ces innovations peuvent paraître modestes. Leur importance devient évidente lorsqu’elles sont intégrées à grande échelle dans le système électrique. Pour ces entreprises, l’enjeu central n’est donc pas seulement d’inventer, mais de trouver des trajectoires d’adoption crédibles permettant de passer du projet pilote à des déploiements répétés. Cela suppose, très concrètement, de s’intégrer aux chaînes d’approvisionnement de donneurs d’ordre industriels ou institutionnels : répondre à leurs exigences de qualité, de certification, de volumes, de délais et de responsabilité contractuelle. Sans cette intégration, même une solution techniquement solide peine à dépasser le stade du projet isolé, faute d’accès aux marchés où se décide la mise à l’échelle.
À l’autre extrémité du spectre, les grands groupes internationaux interviennent sur des ensembles beaucoup plus lourds, tels que groupes turboalternateurs, turbines à gaz, grands transformateurs de transport, équipements HVDC ou systèmes de protection à très haute tension. Ici, l’invention mobilise des capacités d’ingénierie, d’essais et de financement considérables. Elle dépend fortement de l’existence de grands marchés et de clients d’ancrage capables d’absorber le risque des premiers déploiements et d’enclencher la mise à l’échelle.
Entre ces deux pôles, de nombreuses entreprises n’ont pas vocation à inventer de nouveaux produits, mais jouent un rôle tout aussi essentiel comme fabricants ou sous?traitants, produisant selon des designs donnés. Dans ces configurations, la création de valeur repose principalement sur l’adoption d’innovations manufacturières : nouveaux procédés, outils numériques et modes d’organisation permettant d’améliorer la productivité, la qualité et la capacité à livrer en volume, et de bâtir ainsi un avantage concurrentiel durable.
Dans l’ensemble de ces situations, l’adoption n’est pas une étape secondaire. Elle conditionne la compétitivité industrielle dans un contexte d’électrification mondiale rapide, où la capacité à industrialiser, livrer en volume et tenir les délais compte autant que la qualité des idées.
Cette logique change toutefois radicalement lorsqu’on passe de l’industrie au système électrique lui?même. On quitte alors un univers dominé par des logiques de marché et de compétitivité industrielle pour entrer dans celui d’un service essentiel, où la continuité, la sécurité et l’équité priment sur la vitesse d’innovation.
Le cas particulier des compagnies d’électricité
Pour les compagnies d’électricité, l’équilibre est différent. Leur rôle n’est pas de multiplier les inventions, mais de transformer des technologies déjà connues et suffisamment matures en infrastructures fiables, sûres et équitables.
C’est dans cette capacité d’adoption que se crée la valeur collective du système électrique. Mais cette adoption est structurellement plus exigeante que dans d’autres secteurs.
Les compagnies d’électricité évoluent dans des cadres réglementaires qui favorisent souvent l’acquisition d’actifs physiques et de solutions éprouvées. Elles sont soumises à un conservatisme réglementaire fondé sur la prudence et l’équité entre clients. Leur statut de service essentiel exclut toute approche du type «?move fast and break things?» chère à l’industrie du high tech.
Les clients et les gouvernements résistent aussi fortement aux hausses tarifaires, même lorsque celles-ci entraînent une amélioration de la fiabilité, de la résilience ou de la qualité du service. Enfin, les exigences en matière de sécurité sont élevées : sécurité des travailleurs, sécurité du public, prévention des électrocutions, des incendies et des accidents majeurs. Toute adoption doit d’abord satisfaire ces critères.
Ces contraintes ne sont pas des défauts du système. Elles définissent le terrain réel sur lequel l’innovation doit s’inscrire dans le réseau électrique.
Invention et adoption : un double chantier au Canada
Au Canada, le débat oppose souvent, de façon simplificatrice, un déficit d’invention à un déficit d’adoption. Cette opposition est trompeuse. Les deux chantiers sont distincts, mais ils interagissent étroitement.
Du côté de l’invention, la faiblesse canadienne est rarement scientifique. Les compétences existent, y compris dans le secteur de l’électricité. Le problème est plutôt structurel : fragmentation des efforts de recherche, difficulté chronique à passer du prototype à l’industrialisation, accès limité au capital patient et faible tolérance collective au risque technologique. Autrement dit, on sait souvent inventer, mais on peine à transformer une invention en produit ou en système déployable à grande échelle.
Du côté de l’adoption, les freins sont différents. Dans le secteur de l’électricité, plusieurs technologies pourtant bien établies ailleurs peinent à franchir le cap du déploiement industriel au Canada. Le stockage stationnaire et le solaire à grande échelle en sont de bons exemples. Ces technologies sont largement déployées dans plusieurs pays, mais leur adoption demeure inégale au Canada selon les provinces et les cadres réglementaires. Dans certains cas, comme en Ontario, elles sont intégrées de manière structurante au système?; dans d’autres, comme au Québec, elles restent cantonnées à des projets pilotes ou bloquées au stade de l’homologation, malgré une maturité technologique avérée.
L’interaction entre ces deux faiblesses est centrale. Lorsque l’adoption est lente ou incertaine, elle prive l’invention de débouchés réels. Inversement, lorsque l’invention ne débouche pas sur des solutions industrialisables, elle ne peut tout simplement pas être adoptée?; les utilisateurs finaux se tournent alors vers des technologies conçues et mises à l’échelle dans d’autres écosystèmes.
Cette dynamique affecte directement le tissu des PME. Beaucoup de petites et moyennes entreprises s’insèrent dans des chaînes de valeur mondiales comme fournisseurs spécialisés ou sous?traitants, le plus souvent en deuxième ou troisième rang, selon leur degré d’intégration avec les donneurs d’ordre. Ce positionnement n’a rien de négatif en soi : il permet de développer des compétences pointues, de maintenir une base industrielle active et d’accéder à des marchés internationaux.
Le frein principal n’est donc pas l’écosystème local. Dans la plupart des industries, les donneurs d’ordre ont intérêt à faire monter leurs fournisseurs dans la hiérarchie afin de réduire la complexité logistique et de mieux répartir les risques. L’enjeu est plutôt la capacité des PME à atteindre un niveau de maturité technologique, opérationnelle et financière suffisant pour que les acteurs de premier rang puissent leur confier des fonctions plus intégrées en toute confiance. Tant que ce seuil n’est pas franchi, ces PME restent dépendantes de décisions prises ailleurs, ce qui limite leur capacité à capter la valeur stratégique liée à l’architecture des systèmes, à l’intégration et au déploiement en volume.
Il existe pourtant des exemples historiques inspirants. Le développement des lignes électriques à 735 kV au Québec (une innovation majeure au Canada au 20e siècle) n’a pas été le fruit d’une invention isolée, mais celui d’un écosystème cohérent. Il s’est appuyé sur un besoin système clair porté par Hydro Québec un client d’ancrage capable d’adopter à grande échelle, et sur des capacités de recherche et d’essais alors incarnées par l’IREQ, l’Institut de recherche en électricité du Québec, de l’époque.
Dans ce contexte, ASEA, devenue depuis Hitachi Energy , a pu concevoir et fabriquer les premiers transformateurs à 735 kV. Cette innovation, testée, qualifiée et adoptée dans des conditions réelles d’exploitation, a ensuite acquis une reconnaissance internationale et contribué à l’établissement d’un standard mondial. Ce cas illustre ce qui devient possible lorsqu’invention, expérimentation et adoption sont articulées au sein d’un même dispositif institutionnel et industriel.
Aujourd’hui, la transition énergétique et l’intensification de la concurrence internationale rendent ce déséquilibre de moins en moins soutenable. Dans un contexte où certains pays, en particulier la Chine, investissent massivement à la fois dans l’invention et dans le déploiement à grande échelle, renforcer un seul côté sans l’autre revient à accepter un déclassement industriel.
Le rôle des pouvoirs publics
Les pouvoirs publics ont un rôle structurant à jouer comme interface entre invention et adoption. Un levier clé réside dans l’existence de laboratoires publics ou parapublics.
Ces laboratoires peuvent tester, qualifier, certifier et expérimenter des innovations avant leur déploiement à grande échelle. Dans certains cas, ils peuvent aussi contribuer directement à l’invention elle-même, en amont ou en partenariat avec l’industrie.
Ces infrastructures permettent de réduire le risque pour les compagnies d’électricité et pour les grands utilisateurs d’électricité. Elles offrent la possibilité d’apprendre à petite échelle, d’échouer à coût maîtrisé et de clarifier ce qui est réellement prêt pour une adoption industrielle ou systémique, qu’il s’agisse de nouvelles technologies de réseau, de solutions d’efficacité énergétique ou de systèmes électrifiés au cœur de la transition.
Contrairement à une idée reçue, ce rôle n’est pas de sélectionner arbitrairement des «?gagnants?». Il consiste plutôt à fournir des infrastructures de métrologie et d’essais partagées. La mesure et la qualification — par exemple, tester le niveau d’isolement (BIL, Basic Impulse Level) — sont des prérequis à l’homologation et à l’obtention de certifications.
Mais le rôle de ces laboratoires peut aller bien au-delà de la conformité. En offrant des capacités d’essais avancées, ils peuvent contribuer directement au développement des technologies. Cela peut prendre la forme de campagnes d’essais itératives pour améliorer un design, d’exploration de limites physiques, de compréhension fine des modes de défaillance ou encore d’un appui théorique pour interpréter les résultats et orienter les choix d’ingénierie.
Dans ce cadre, la métrologie n’est plus seulement un outil de conformité. Elle devient un instrument d’apprentissage collectif.
En donnant un accès équitable à ces essais de haute puissance et à cette expertise, l’État lève un verrou majeur pour les PME innovantes qui n’ont pas les moyens de posséder leurs propres laboratoires. Il accélère ainsi non seulement l’homologation, mais aussi la maturation technologique et le passage de l’invention à une adoption réellement industrialisable.
Concrètement, cela pourrait passer par une évolution de l’IREQ, devenu le centre de recherche d’Hydro?Québec (CRHQ), vers un véritable laboratoire public de recherche industrielle au service de l’ensemble de l’industrie. Plusieurs modèles existent déjà, reposant sur diverses logiques institutionnelles : Powertech en Colombie?Britannique, filiale de BC Hydro?; Kinectrics en Ontario, issue du démantèlement d’Ontario Hydro et aujourd’hui une entreprise privée?; ou encore le NREL aux États?Unis, laboratoire national fédéral. Chacun de ces modèles présente des caractéristiques propres en matière de gouvernance, de financement et de relation avec l’industrie.
L’enjeu n’est pas de demander aux services publics d’inventer comme des entreprises de haute technologie ni de transformer les laboratoires en incubateurs improvisés. Il est de clarifier les rôles, de compléter l’écosystème d’innovation et de créer des passerelles crédibles entre invention et adoption.
Conclusion
Dans le secteur de l’énergie, l’invention et l’adoption correspondent à deux fonctions différentes, mais étroitement liées. L’une élargit le champ des possibles?; l’autre transforme ces possibilités en valeur. Au Canada et au Québec, les deux doivent être renforcées.
Sans invention, il n’y a pas d’options. Sans adoption, il n’y a pas de valeur. Et dans les systèmes électriques, c’est l’adoption qui fait passer une promesse technologique du stade de solution potentielle à celui d’infrastructure utile.
Le véritable défi de la transition énergétique ne se joue ni uniquement dans les laboratoires, ni uniquement dans les salles de conseil d’administration. Il se situe dans la capacité collective à faire progresser ces deux fonctions de manière cohérente et lucide, dans un contexte de concurrence mondiale où le coût de l’inaction devient rapidement aussi élevé que celui de l’action.
L’histoire du 735 kV au Québec rappelle que, lorsque l’invention répond à un besoin système clair et qu’elle est suivie d’une adoption ambitieuse par un client d’ancrage, l’innovation peut non seulement transformer un réseau, mais aussi rayonner bien au-delà des frontières. La transition énergétique pose aujourd’hui un défi de même nature : moins spectaculaire dans ses technologies, mais tout aussi exigeant dans sa capacité d’orchestration.
Openness to innovation is essential in the energy sector. But we must be clear about what innovation actually means. Too often, it is spontaneously equated with invention: the technological breakthrough, the promising prototype, sometimes embodied in the image of the wild?haired mad scientist.
Adoption points to a different, and equally decisive, reality. It is less an act of creation than the work of a systems integrator: selecting components, assembling them, making them work together, and ensuring their reliability over time. Without this disciplined implementation, even the most technically elegant idea never becomes durable infrastructure.
This perspective aligns explicitly with the OECD’s Oslo Manual, which states that “innovation is more than a new idea or an invention. An innovation requires implementation, either by being put into active use or by being made available for use by other parties, firms, individuals or organizations.”
Put differently, and as a friend once remarked, innovation is a novelty put into practice.
In reality, the innovation process is more complex and progressive. It includes multiple stages described in different models, such as research, exploratory development, demonstration, industrialization, commercialization, and diffusion. Each stage involves different actors, risks, and capabilities. In this text, however, I make a deliberate analytical simplification. Rather than describing the entire chain, I focus on two essential elements: invention, which creates options, and adoption, which turns those options into value.
In electricity systems, invention and adoption are complementary but follow different logics and are often carried by different actors. The issue is therefore not to choose between invention and adoption, but to strengthen the capabilities required for both.
In Canada, and particularly in Québec, the challenge is not to arbitrate between these two functions. It is to develop them simultaneously, while recognizing that each raises distinct issues and calls for different responses.
Invention and adoption are complementary
Invention expands the space of possibilities. It creates technological options, new concepts, potential solutions. Adoption transforms these options into real solutions, integrated into the system and used at scale.
Invention opens doors. Adoption determines which doors are crossed sustainably.
This relationship is not a linear ribbon unrolling from the lab to the market. It is an iterative cycle: adoption under real?world conditions generates data and surprises that become the raw material for the next wave of innovation. In energy, adoption is not just the finish line; it is the compass that tells invention where to focus next.
Blockages in the energy sector therefore do not stem solely from a lack of invention, nor only from institutional conservatism that slows adoption. They arise when one advances faster than the other, or when one is assumed to compensate for the absence of the other. In other words, neither invention alone nor adoption alone makes a system; what matters is their articulation over time and across the industrial landscape.
What adoption reveals that invention ignores
As long as a technology remains marginal, it can appear simple, elegant, and promising. It is when it is deployed at scale that the reality of the system emerges.
Adoption then acts as a revealer. It exposes physical network constraints, coexistence with assets amortized over decades, limits of business models, and regulatory frictions. From the perspective of end users — firms as well as households — it also brings to light integration costs, behavioural changes, operational risks, and financial constraints that are often underestimated.
Adoption is also the moment when technology meets usage. A solution can be technically robust and still fail if it does not fit existing practices or earn user acceptance. Successful adoption therefore requires going beyond technical performance to address interfaces, incentives, and tariff structures. It is not simply about imposing infrastructure, but about designing uses that are compatible with the system’s day?to?day operation.
This is why a technology that looks convincing in the lab or in a pilot project can prove disappointing, costly, or complex once confronted with the real system. Failure rarely stems from intrinsic performance; it more often arises from system?wide impacts: network side effects, unforeseen interactions with other equipment, increased operational complexity, or the shifting of costs and risks to other actors. Adoption is thus the true test of system coherence that invention alone cannot pass.
Electric supply chain: inventing and adopting under constraint
For technology suppliers, system providers, and manufacturing firms in the electricity sector, innovation always rests on a combination of invention and adoption. But that combination varies widely depending on the type of actor, firm size, and the nature of the equipment involved.
On the SME side, invention most often concerns smaller but high?value building blocks: network control and management systems, energy efficiency solutions, home automation, software, electric vehicle charging equipment and services, sensors, and automation. Taken individually, these innovations may seem modest. Their importance becomes clear when they are integrated at scale into the electricity system. For these firms, the central challenge is therefore not only to invent, but to establish credible adoption pathways that move from pilot projects to repeated deployments. Concretely, this requires integration into the supply chains of industrial or institutional clients: meeting requirements for quality, certification, volumes, timelines, and contractual responsibility. Without such integration, even a technically sound solution struggles to move beyond isolated projects, lacking access to the markets where scale is decided.
At the other end of the spectrum, large international groups operate on far larger systems: turbogenerator sets, gas turbines, large transmission transformers, HVDC equipment, or very?high?voltage protection systems. Here, invention mobilizes substantial engineering, testing, and financing capabilities. It depends heavily on the existence of large markets and anchor customers able to absorb first?deployment risk and trigger scale?up.
Between these two poles, many firms are not meant to invent new products, but play an equally essential role as manufacturers or subcontractors producing to given designs. In these configurations, value creation rests mainly on adopting manufacturing innovations: new processes, digital tools, and organizational practices that improve productivity and quality, enable delivery at scale, and build a durable competitive advantage.
Across all these situations, adoption is not a secondary step. It conditions industrial competitiveness in a context of rapid global electrification, where the ability to industrialize, deliver at volume, and meet deadlines matters as much as the quality of ideas.
This logic changes fundamentally when we move from industry to the electricity system itself. We leave a world dominated by market logics and industrial competition and enter that of an essential service, where continuity, safety, and equity take precedence over the pace of innovation.
The specific case of electric utilities
For electric utilities, the balance is different. Their role is not to multiply inventions, but to transform technologies that are already known and sufficiently mature into reliable, safe, and equitable infrastructure.
It is in this capacity for adoption that the collective value of the electricity system is created. But adoption here is structurally more demanding than in other sectors.
Utilities operate within regulatory frameworks that often favour the acquisition of physical assets and proven solutions. They are subject to regulatory conservatism rooted in prudence and customer equity. Their status as essential services rules out any “move fast and break things” approach associated with high tech.
Customers and governments also strongly resist tariff increases, even when these would improve reliability, resilience, or service quality. Finally, safety requirements are stringent: worker safety, public safety, and the prevention of electrocutions, fires, and major accidents. Any adoption must first satisfy these criteria.
These constraints are not system flaws. They define the real terrain on which innovation must take root in electricity networks.
Invention and adoption: a dual challenge in Canada
In Canada, debate often pits an invention deficit against an adoption deficit. This opposition is misleading. The two challenges are distinct, but they interact closely.
On the invention side, Canadian weakness is rarely scientific. Capabilities exist, including in the electricity sector. The problem is structural: fragmented research efforts, chronic difficulty moving from prototype to industrialization, limited access to patient capital, and low collective tolerance for technological risk. In short, we often know how to invent, but struggle to turn inventions into products or systems deployable at scale.
On the adoption side, obstacles are different. In electricity, several technologies well established elsewhere struggle to cross the threshold of industrial deployment in Canada. Stationary storage and utility?scale solar are good examples. These technologies are widely deployed in many countries, but adoption in Canada remains uneven across provinces and regulatory frameworks. In some cases, such as Ontario, they are structurally integrated into the system; in others, such as Québec, they remain confined to pilot projects or stalled at the certification stage, despite proven technological maturity.
The interaction between these two weaknesses is central. When adoption is slow or uncertain, invention lacks real outlets. Conversely, when invention does not yield industrializable solutions, it cannot be adopted at all; end users then turn to technologies designed and scaled elsewhere.
This dynamic directly affects the SME base. Many small and medium enterprises integrate into global value chains as specialized suppliers or subcontractors, most often as tier 2 or tier 3, depending on their degree of integration with prime suppliers. This positioning is not negative in itself: it enables skill development, maintains an active industrial base, and provides access to international markets.
The main constraint is, therefore, not the local ecosystem. In most industries, tier 1 suppliers have an interest in moving their suppliers up the hierarchy to reduce logistical complexity and spread risk. The real issue is whether SMEs can reach a level of technological, operational, and financial maturity that allows tier 1 actors to entrust them with more integrated functions with confidence. Until that threshold is crossed, these firms remain dependent on decisions made elsewhere, limiting their ability to capture the strategic value associated with system architecture, integration, and large?scale deployment.
There are, however, inspiring historical examples. The development of the 735 kV transmission system in Québec (a major innovation in 20th century Canada) was not the result of an isolated invention, but of a coherent ecosystem. It rested on a clear system need carried by Hydro Québec, an anchor customer able to adopt at scale, and research and testing capabilities embodied at the time by IREQ (Institut de recherche en électricité du Québec).
In that context, ASEA, later part of Hitachi Energy, was able to design and manufacture the first 735 kV transformers. Tested, qualified, and adopted under real operating conditions, this innovation gained international recognition and contributed to establishing a global standard. It illustrates what becomes possible when invention, experimentation, and adoption are articulated within a single institutional and industrial framework.
Today, the energy transition and intensifying global competition make this imbalance increasingly unsustainable. In a context where some countries, notably China, invest massively in both invention and large?scale deployment, strengthening only one side without the other amounts to accepting industrial decline.
The role of public authorities
Public authorities have a structuring role to play as an interface between invention and adoption. A key lever lies in the existence of public or parapublic laboratories.
These laboratories can test, qualify, certify, and experiment with innovations before large?scale deployment. In some cases, they can also contribute directly to invention itself, upstream or in partnership with industry.
Such infrastructure reduces risk for utilities and large electricity users alike. It allows learning at small scale, failure at controlled costs, and clarification of what is truly ready for industrial or system?wide adoption, whether network technologies, energy efficiency solutions, or electrified systems central to the transition.
Contrary to a common misconception, this role is not about arbitrarily selecting “winners.” It is about providing shared metrology and testing infrastructure. Measurement and qualification — for example, testing insulation strength (BIL, Basic Impulse Level) — are prerequisites for certification.
But the role of these laboratories can go far beyond compliance. By offering advanced testing capabilities, they can directly support technology development through iterative test campaigns, exploration of physical limits, detailed understanding of failure modes, and theoretical support to interpret results and guide engineering choices.
In this context, metrology is no longer merely a compliance tool. It becomes an instrument of collective learning.
By providing equitable access to high?power testing and expertise, the state removes a major barrier for innovative SMEs that cannot afford their own laboratories. It accelerates not only certification, but technological maturation and the transition from invention to truly industrializable adoption.
Concretely, this could involve the transformation of IREQ, now the Hydro-Québec Research Centre (CRHQ), toward a genuine public industrial research laboratory serving the entire industry. Several models already exist, based on different institutional logics: Powertech Labs Inc. in British Columbia, a subsidiary of BC Hydro ; Kinectrics in Ontario, born from the dismantling of Ontario Hydro and now a private firm; and the NREL in the United States, a federal national laboratory. Each model has distinct characteristics in governance, funding, and industry relations.
The objective is not to ask public utilities to invent like high?tech firms, nor to turn laboratories into improvised incubators. It is to clarify roles, complete the innovation ecosystem, and build credible bridges between invention and adoption.
Conclusion
In the energy sector, invention and adoption correspond to two different but closely linked functions. One expands the space of possibilities; the other turns those possibilities into value. In Canada and Québec, both must be strengthened.
Without invention, there are no options. Without adoption, there is no value. And in electricity systems, adoption is what turns a technological promise from a potential solution into useful infrastructure.
The real challenge of the energy transition is not confined to laboratories or boardrooms. It lies in our collective ability to advance these two functions coherently and lucidly, in a context of global competition where the cost of inaction quickly becomes as high as the cost of action.
The history of 735 kV in Québec reminds us that when invention addresses a clear system need and is followed by ambitious adoption by an anchor customer, innovation can not only transform a network, but also radiate far beyond its borders. Today’s energy transition poses a challenge of the same nature: less spectacular in its technologies, but just as demanding in its capacity for orchestration.
Une stratégie robuste pour la transition énergétique peut se résumer simplement: électrifier tout ce qui peut l’être, le plus rapidement possible, puis s’occuper de ce qui ne peut pas encore l’être. Le point clé est que « tout ce qui peut l’être » n’est pas statique. Cette frontière recule avec le temps, à mesure que les technologies mûrissent, que les coûts baissent et que les systèmes s’adaptent.
Cette formulation est souvent critiquée comme étant simpliste. En réalité, elle correspond à la façon dont les grandes transitions technologiques se produisent.
Cet article se limite volontairement à la transition énergétique. L’électrification des usages finaux est une stratégie puissante et nécessaire pour transformer le système énergétique, mais elle ne constitue pas, à elle seule, une réponse complète au changement climatique. D’autres dimensions de la transition, comme l’usage du territoire, l’agriculture ou des procédés industriels sans lien direct avec l’énergie, sont volontairement exclues du périmètre.
La priorité donnée à l’électrification repose sur trois arguments simples et solides.
Premièrement, les usages électrifiés sont fondamentalement plus efficaces que leurs équivalents fossiles. Il ne s’agit pas d’un gain marginal. Les thermopompes fournissent de deux à quatre unités de chaleur utile pour chaque unité d’électricité consommée. Les véhicules électriques convertissent la majeure partie de l’énergie en mouvement, alors que les moteurs à combustion interne dissipent l’essentiel sous forme de chaleur.
Même lorsque l’électricité est produite à partir de combustibles fossiles, cet avantage d’efficacité demeure souvent. Utiliser du gaz naturel pour produire de l’électricité et alimenter une thermopompe peut fournir plus de chaleur utile que de brûler ce même gaz directement dans une fournaise classique. C’est pourquoi l’électrification peut réduire les émissions avant même que le réseau électrique soit entièrement décarboné.
En raison de cet écart d’efficacité, attendre un système électrique parfaitement propre avant d’électrifier les usages finaux constitue une erreur de raisonnement. On confond l’optimisation du système avec la séquence d’action.
Deuxièmement, l’électrification des usages verrouille la transition.
Lorsqu’un bâtiment est chauffé à l’aide d’une thermopompe ou qu’un parc de véhicules est électrifié, la direction est donnée. Les améliorations futures de la production électrique se traduisent automatiquement par une baisse des émissions. L’inverse n’est pas vrai. Même une chaudière au gaz très performante ou un moteur à combustion efficace demeure un actif fossile pour toute sa durée de vie.
Cet effet de verrouillage est crucial, car les infrastructures ont des durées de vie longues. Retarder l’électrification aujourd’hui dans l’attente d’un réseau plus propre garantit des émissions cumulées plus élevées pendant des décennies.
Troisièmement, retarder l’électrification lorsqu’elle est déjà viable n’est pas un choix neutre.
Les arguments visant à attendre que tout soit résolu, que les réseaux soient parfaitement propres ou que des solutions existent pour tous les secteurs servent systématiquement un même intérêt: prolonger la durée de vie des actifs fossiles. Ce schéma n’est pas accidentel. Il correspond à une stratégie délibérée utilisée par des acteurs en place pour ralentir des transitions qui menacent leurs modèles d’affaires.
Les secteurs dits « difficiles à décarboner » sont bien réels et méritent un travail sérieux. Il s’agit notamment de l’aviation long-courrier, de la production de ciment et d’acier, ou de certains procédés chimiques. Mais s’en servir pour justifier le report de l’électrification des bâtiments, des transports et de l’industrie légère revient à déformer le problème. C’est substituer l’inaction au progrès.
Une stratégie dynamique, pas statique
La transition énergétique n’est pas un problème d’optimisation que l’on résout une fois pour toutes. C’est un processus dynamique. Ce qui est difficile aujourd’hui devient banal demain. Des technologies marginales deviennent dominantes par le déploiement, l’apprentissage et l’effet d’échelle.
La posture stratégique adéquate n’est donc pas d’établir un ordre figé des secteurs, mais de pousser l’électrification partout où elle est déjà pertinente, tout en élargissant continuellement ce champ. Le renforcement des réseaux, le stockage, les investissements en transport et une gestion plus intelligente du système doivent progresser en parallèle de l’électrification, et non en amont ni comme condition préalable.
Électrifier tout ce qui peut l’être. Puis s’occuper du reste. Et revoir régulièrement ce que signifie réellement « tout ce qui peut l’être ».
Qu’en est-il du prix de l’électricité?
Une inquiétude fréquente est que l’électrification accroisse la demande d’électricité et fasse augmenter les prix, du moins à court terme lors des phases d’investissement intensif. Cette lecture ne considère qu’un côté de l’équation.
L’électrification réduit ou élimine les dépenses en essence, diesel, mazout et gaz naturel. Même si les factures d’électricité augmentent temporairement, les coûts énergétiques totaux des ménages et des entreprises diminuent souvent. Ce qui importe économiquement, c’est le coût des services énergétiques – chauffage, mobilité, production – et non le prix unitaire de l’électricité pris isolément.
Enfin, les prix de l’électricité sont autant le produit d’institutions que de technologies. De nombreux marchés et cadres réglementaires ont été conçus pour des systèmes thermiques à combustibles, caractérisés par des coûts marginaux élevés. À mesure que les renouvelables, le stockage et la flexibilité de la demande prennent de l’ampleur, ces cadres représentent de plus en plus mal les coûts réels. Lorsque les prix montent, il s’agit souvent d’un décalage institutionnel, et non d’un échec de l’électrification.
Vue sous cet angle, l’électrification n’est pas un risque de coût. C’est un moyen de réduire l’exposition à la volatilité des marchés fossiles mondiaux et d’orienter le système énergétique vers des coûts planifiables, régulables et stables localement.
L’essentiel sur le plan stratégique
L’électrification ne consiste pas à ordonner abstraitement des technologies. Il s’agit de faire des choix irréversibles et sans regret, qui améliorent l’efficacité, réduisent l’exposition aux marchés volatils des combustibles et forcent l’évolution du système.
Électrifier dès maintenant tout ce qui fonctionne, parce que cela fonctionne, parce que cela verrouille le progrès et parce que le report n’est que rarement innocent. Puis s’occuper de ce qui reste, en sachant que la définition même de « ce qui reste » continuera de se réduire.
Ce n’est pas une idéologie. C’est ainsi que les grands systèmes techniques évoluent.
Un exemple récent et familier l’illustre clairement. L’iPhone n’a pas attendu que les réseaux mobiles soient prêts. Il a d’abord transformé les usages, verrouillant une demande intensive en données; il a mis en évidence les limites du système, forçant les opérateurs cellulaires à faire face à la congestion et aux lacunes de couverture; et il a profondément réorienté les incitatifs à l’investissement vers les réseaux numériques. En parallèle, l’ampleur de la demande en données a entraîné une baisse soutenue du coût unitaire de transmission, à mesure que les investissements, l’apprentissage et la densification progressaient plus vite que le trafic. Les réseaux 3G, puis 4G, et finalement l’infrastructure mobile actuelle ont été tirés par les appareils, et non poussés par une optimisation préalable des réseaux ou par des injonctions réglementaires.
L’électrification suit la même logique: déployer ce qui fonctionne déjà, rendre la demande irréversible, révéler les contraintes du système et forcer l’adaptation du reste.
A robust strategy for the energy transition can be stated plainly: electrify everything you can, as fast as you can, and then deal with what cannot yet be electrified. The key point is that “everything you can” is not static. It expands over time as technologies mature, costs fall, and systems adapt.
This framing is often criticized as oversimplified, but it accurately reflects the reality of how major technological transitions unfold.
This article focuses deliberately on the energy transition. Electrifying end uses is a powerful and necessary strategy for transforming the energy system, but it is not, on its own, a complete response to climate change. Other dimensions of the transition, such as land use, agriculture, and industrial processes unrelated to energy, are outside the scope of this discussion.
The case for prioritizing electrification rests on three simple and robust arguments.
First, electrified end uses are fundamentally more efficient than their fossil-based counterparts. This is not a marginal gain. Heat pumps deliver two to four units of useful heat for each unit of electricity consumed. Electric vehicles convert most of the energy they draw into motion, while internal combustion engines waste the majority as heat.
Even when electricity is generated from fossil fuels, this efficiency advantage often holds. Using natural gas to generate electricity and then running a heat pump can still deliver more useful heat than burning the same gas directly in a typical furnace. This is why electrification can reduce emissions before the power system is fully decarbonized.
Because of this efficiency gap, electrification often reduces emissions even when electricity generation is not fully clean. Waiting for a perfectly decarbonized power system before electrifying end uses is therefore a category error. It confuses system optimization with sequencing.
Second, electrifying end uses locks in the transition.
Once a building is heated with a heat pump, or a fleet is electrified, the direction of travel is set. Future improvements in generation automatically translate into lower emissions. The opposite is not true. Even a very efficient gas boiler or combustion engine remains a fossil asset for its entire lifetime.
This lock-in effect matters because infrastructure lifetimes are long. Delaying electrification today in order to wait for cleaner power tomorrow guarantees higher cumulative emissions over decades.
Third, delaying electrification where it is already viable is not a neutral choice.
Arguments to wait until everything is solved, until grids are perfectly clean, or until alternatives for every sector are available consistently serve one interest: extending the life of fossil-based assets. This pattern is not accidental. It is a deliberate strategy that has been used by incumbent industries to slow down transitions that threaten their business models.
Hard-to-abate sectors are real and deserve serious work. These include activities such as long-haul aviation, cement and steel manufacturing, and certain chemical processes, where direct electrification remains difficult today. But using them as a justification to postpone electrification in buildings, transport, and light industry is a distortion of the problem. It substitutes delay for progress and protects incumbents at the expense of long-term system performance.
A dynamic, not a static, strategy
The energy transition is not a single optimization problem solved once. It is a dynamic process. What is difficult today becomes routine tomorrow. Technologies that are marginal now become mainstream through deployment, learning, and scale.
The correct strategic posture is therefore not to rank sectors once and for all, but to push electrification aggressively wherever it already makes sense, while continuously expanding that frontier. Grid reinforcement, storage, transmission upgrades, and smarter system management must proceed in parallel with electrification, not ahead of it, and certainly not as a precondition.
Electrify everything you can. Then deal with the rest. And keep revisiting what “everything you can” actually means.
What about electricity prices?
A common concern is that increased electrification will raise electricity demand and therefore electricity prices, at least in the short term during periods of rapid investment. This looks only at one side of the ledger.
Electrification reduces or eliminates spending on gasoline, diesel, fuel oil, and natural gas. Even when electricity bills increase temporarily, total energy costs for households and firms often fall. What matters economically is the cost of energy services such as heat, mobility, and industrial output, not the unit price of electricity viewed in isolation.
Finally, electricity prices are shaped as much by institutions as by technology. Many markets and regulatory regimes were designed for fuel-based, thermal systems, with high marginal costs. As renewables, storage, and flexible demand grow, these frameworks increasingly misrepresent underlying costs. When prices rise, it is often a sign of institutional lag, not a failure of electrification.
Seen this way, electrification is not a cost risk. It is a way to reduce long-term exposure to volatile fossil fuel global markets and to shift energy systems toward costs that can be planned, regulated, and stabilized locally.
The strategic takeaway
Electrification is not about sequencing technologies in the abstract. It is about making irreversible, no-regret, choices that improve efficiency, reduce exposure to volatile fuel markets, and force the system to evolve.
Electrify everything you can now, because it works, because it locks in progress, and because delay is rarely innocent. Then deal with what remains, knowing that the definition of “what remains” will keep shrinking.
This is not ideology. It is how large technical systems actually change.
A recent and familiar example illustrates this clearly. The iPhone did not wait for mobile networks to be ready. It reshaped end-use demand first, locking in data-intensive behaviour; it exposed system bottlenecks immediately, forcing cellular operators to confront congestion and coverage gaps; and it shifted investment incentives decisively toward digital networks. At the same time, the massive scale of data demand drove a sustained decline in the unit cost of transmitting data, as investment, learning, and densification outpaced traffic growth. 3G, then 4G, and eventually today’s mobile data infrastructure were pulled forward by devices, not pushed by pre-emptive network optimisation or regulatory dictates.
Electrification follows the same pattern: deploy what already works, make demand irreversible, reveal system constraints, and force the rest of the system to adapt.
L’énergie n’est pas seulement une question de carbone, de coûts ou de technologie… c’est aussi une question d’espace et de temps. Chaque filière électrique mobilise une portion du territoire, parfois visible, parfois diffuse, pendant des durées qui varient fortement entre la construction, l’exploitation et la remédiation. Ces différences spatio-temporelles influencent profondément la planification, l’acceptabilité et la durabilité de nos choix énergétiques.
Le tableau comparatif synthétique ci-dessous (la version complète est en annexe) montre à quel point l’occupation du territoire varie selon les technologies de production, mais aussi comment la nature et la durée de cette occupation diffèrent : permanente ou temporaire, exclusive ou partagée, extractive ou réversible.
(Dans la mesure du possible, les données et hypothèses utilisées prennent le Québec comme référence géographique et technique.)
Tableau synthétique — Empreinte foncière par filière (ha/TWh/an)
Unités : hectares par TWh d’électricité livrée annuellement (ha/TWh/an). Les chiffres incluent les emprises de transport, les chaînes d’approvisionnement et, le cas échéant, un crédit de co-usage. Le tableau complet est présenté en annexe. Les détails des hypothèses qui sous-tendent ces tableaux sont disponibles sur demande dans un document distinct. Un hectare est équivalent à environ 108?000 pi² ou 2,5 acres.
L’hydroélectricité à réservoir a une empreinte spatio-temporelle importante, mais elle est très pratique, car sa puissance est réglable, contrairement au nucléaire ou à l’hydroélectricité au fil de l’eau qui fonctionnent en continu. Solaire et éolien restent intermittents, mais au Québec, les grands réservoirs facilitent leur intégration : l’électricité solaire produite l’été permet de garder l’eau pour les pointes hivernales.
Ces tableaux montrent à quel point l’occupation du territoire varie selon les filières de production d’électricité, et surtout, comment la nature et la durée de cette occupation diffèrent. Les grands réservoirs d’Hydro-Québec et les filières fossiles dominent en superficie absolue et en durée, mais cette occupation n’a ni la même intensité d’usage ni la même réversibilité que celle des technologies récentes.
Méthodologie
La méthodologie utilisée pour arriver à ces tableaux repose sur une approche progressive :
On part de l’empreinte directe, c’est-à-dire la surface physique occupée par les infrastructures de production, puis on applique trois ajustements pour obtenir l’empreinte ajustée.
On ajoute d’abord les extensions spatiales associées à la chaîne d’approvisionnement et au transport d’électricité, qui représentent la portion amont et aval du cycle énergétique.
On soustrait ensuite le co-usage (agricole, récréatif, écologique) pour tenir compte des surfaces partagées.
Enfin, on pondère par la durée d’occupation afin d’obtenir une mesure spatio-temporelle nette, exprimée en hectares par TWh d’énergie livrée par an.
Cette méthode permet une comparaison équitable entre des technologies à des échelles très différentes — de quelques panneaux solaires à un complexe hydroélectrique continental.
L’empreinte directe
L’empreinte directe correspond à la surface occupée physiquement par les infrastructures d’une centrale ou d’un parc de production. C’est le point de départ de toute comparaison entre filières, car elle traduit la portion du territoire directement touchée par la production d’énergie — le noyau et la zone liée au projet.
En plus du noyau, soit la centrale elle-même, l’empreinte directe inclut toute la zone liée au projet, y compris l’espace périphérique nécessaire au fonctionnement ou à la sécurité des installations. Elle varie fortement d’une filière à l’autre :
Dans le cas du nucléaire, elle comprend la zone d’exclusion et la zone de planification d’urgence, qui s’étendent sur plusieurs kilomètres autour du site et où les usages sont restreints.
Pour les centrales au charbon ou au gaz, elle inclut les marges de sécurité, les bassins de refroidissement et les zones industrielles adjacentes.
Pour l’hydroélectricité, elle comprend les digues et les réservoirs, souvent inondés de façon permanente.
Dans le cas de l’éolien, il s’agit des zones d’espacement entre turbines et des voies d’accès
Pour le solaire, des chemins de service et des marges autour des parcs, ou l’espace de toiture.
L’ensemble de ces zones élargit considérablement l’emprise apparente du projet, sans pour autant être toujours entièrement exclusif. Elles doivent donc être considérées comme une composante essentielle de l’empreinte directe.
Variabilité entre filières
Les grands ouvrages hydroélectriques submergent des milliers de kilomètres carrés, transformant durablement le paysage.
Les centrales thermiques ou nucléaires ont une empreinte compacte, concentrée autour des bâtiments et des aires de sécurité.
Les parcs éoliens et solaires s’étendent sur de grandes surfaces, mais leur occupation matérielle est faible : une petite fraction du sol est réellement construite.
Trois ajustements à l’empreinte directe
Trois facteurs principaux viennent donc ajuster l’empreinte directe :
1. Chaîne d’approvisionnement et transport d’électricité — une extension spatiale
L’empreinte réelle d’une filière dépasse largement le site de production. En amont, elle inclut les zones d’extraction et de transformation des matériaux et des combustibles?; en aval, elle comprend les réseaux de transport d’électricité nécessaires pour acheminer l’énergie vers les centres de charge.
Cet effet revêt une importance particulière pour l’hydroélectricité à réservoir au Québec : les lignes de transport de 315 à 735 kV peuvent parcourir plusieurs centaines de kilomètres, voire dépasser 1?500 km, afin d’acheminer l’électricité des centrales nordiques vers les régions consommatrices du sud. À l’inverse, les autres filières — solaire, éolien, thermique — peuvent être implantées beaucoup plus près des centres de charge, voire cosituées.
En ce qui concerne les filières fossiles et nucléaires, la chaîne d’approvisionnement (extraction minière, oléoducs, usines de traitement) domine souvent l’empreinte globale. En revanche, pour les énergies renouvelables distribuées, cette contribution reste négligeable.
2. Co-usage — un crédit spatial
Le co-usage s’applique, à des degrés variables, à l’ensemble des filières.
Dans le cas de l’éolien terrestre ou du solaire vertical bifacial, plus de 80 % du terrain reste disponible pour d’autres usages — agricoles, forestiers ou écologiques.
Pour l’hydroélectricité au fil de l’eau, les berges et les plans d’eau peuvent servir à la navigation, à la pêche ou aux loisirs.
Les centrales thermiques ou nucléaires, bien que plus confinées, peuvent parfois être entourées de zones écologiques protégées ou d’aires de recherche et de surveillance environnementale.
Même les réservoirs hydroélectriques, bien que permanents, offrent un certain co-usage récréatif.
Par contraste, le solaire en toiture, bien qu’excellent pour le co-usage, demeure un potentiel réel, mais limité, principalement en raison de la surface disponible, de la géométrie et de l’orientation des toits. Même pleinement mobilisé, il ne peut couvrir qu’une part relativement modeste de la demande provinciale.
Le co-usage agit donc comme un crédit spatial qui réduit l’empreinte effective d’une filière en valorisant l’intégration d’autres fonctions sur le même territoire. Il devient ainsi un indicateur de compatibilité territoriale entre énergie et autres fonctions socioéconomiques.
3. Dimension temporelle — une occupation prolongée
Enfin, la durée pendant laquelle le territoire reste occupé — de la construction à la remédiation — influence directement l’intensité réelle de l’emprise. Les filières à cycles longs (hydro, nucléaire, fossiles) immobilisent des surfaces pendant des décennies, voire de façon permanente, tandis que les renouvelables récents (solaire, éolien) ont des cycles plus courts et réversibles.
Construction : un barrage ou une centrale thermique exige plusieurs années, parfois une décennie, avant d’atteindre sa pleine capacité, alors qu’un parc éolien ou solaire se construit en moins de deux ans.
Fin de vie et remédiation : les sites fossiles et nucléaires nécessitent des décennies de démantèlement et de suivi?; les projets éoliens ou solaires peuvent être démontés, remotorisés ou réaffectés en quelques mois.
Temps non productif : pendant ces phases de construction ou de réhabilitation, le territoire reste occupé, mais ne produit pas d’énergie. Les filières à cycles longs subissent donc une inefficience temporelle plus marquée.
Ces trois ajustements — chaîne d’approvisionnement et transport d’électricité, co-usage, et temporalité — redéfinissent la notion même d’empreinte foncière, en l’élargissant d’une surface brute à une occupation spatio-temporelle nette.
Hydroélectricité et acceptabilité
L’hydroélectricité, fondement du système québécois, se distingue par sa stabilité et son intégration paysagère historique, mais les réservoirs restent une occupation permanente du sol — un legs irréversible. Ce modèle a longtemps bénéficié d’une large acceptabilité sociale au sud du Québec, où l’hydroélectricité est perçue comme un symbole de modernité et de souveraineté énergétique. Il n’en va pas de même pour plusieurs Premières Nations du Nord, pour qui ces ouvrages ont entraîné des pertes territoriales et culturelles profondes, et continuent de soulever des enjeux de reconnaissance, de gouvernance et de partage des bénéfices.
Co-usage vertical : le cas de Beauharnois
Le canal d’amenée de la centrale hydroélectrique de Beauharnois montre bien qu’une infrastructure existante peut être multifonctionnelle. Ce canal artificiel, long d’environ 25 kilomètres et large d’environ 1 kilomètre (soit environ 2?500 hectares de surface d’eau), fait partie intégrante de la voie maritime du Saint-Laurent et sert à la navigation commerciale et au contrôle des niveaux d’eau. Cette double fonction en fait un exemple remarquable de co-usage hydraulique et logistique. Le même canal pourrait accueillir du solaire flottant (floating PV) sans nuire à la fonction hydraulique ni à la navigation. À une densité réaliste de 0,5 MW/ha, on pourrait y installer environ 1,2 GW de panneaux produisant 1,5 à 1,8 TWh/an, soit près de 15 % de la production actuelle de Beauharnois (11,7 TWh). Ce type d’intégration permettrait d’augmenter la production électrique sans nouvelle emprise foncière : une forme de co-usage technologique et territorial déjà anthropisé.
Enjeux et perspectives
L’analyse foncière met en lumière trois enseignements structurants :
L’importance du transport et de l’approvisionnement : plus une source est éloignée des centres de charge, plus l’emprise associée aux lignes de transport devient significative. Dans le cas des centrales fossiles, il faut aussi considérer les réseaux d’approvisionnement (p. ex. gazoducs) qui, comme le canal de Beauharnois pour la voie maritime du Saint-Laurent, constituent une part importante de l’empreinte spatiale réelle du système énergétique.
La valeur du co-usage : ce n’est pas tant la superficie brute qui compte que la capacité d’un projet à partager l’espace avec d’autres fonctions.
La réversibilité et la remédiation : les technologies récentes — éolien, solaire, stockage — se distinguent par leur capacité à libérer ou réutiliser les terrains à la fin de vie d’une centrale ou d’un parc.
Sur ce dernier point, les filières fossiles et le nucléaire laissent souvent une empreinte durable :
Les mines de charbon et les bassins de cendres nécessitent des décennies de surveillance environnementale?;
Les puits de gaz et les pipelines exigent un scellement et un suivi à long terme pour éviter les fuites de méthane?;
Les centrales nucléaires doivent être démantelées sur plusieurs décennies, et les sites de stockage des déchets demeurent interdits pendant des générations.
Cette différence temporelle d’occupation — le temps pendant lequel le territoire reste effectivement mobilisé même si la centrale ne produit plus — est aussi déterminante que la superficie elle-même.
Ces éléments suggèrent qu’à long terme, le véritable avantage des filières éolienne et solaire ne réside pas seulement dans leurs faibles émissions, mais dans leur empreinte spatio-temporelle qualitative : co-utilisable, réversible et temporellement limitée.
Conclusion
L’empreinte foncière des filières électriques ne se résume pas à une mesure d’hectares. Elle raconte notre rapport collectif au territoire : ce que nous acceptons de transformer, de partager ou de préserver pour produire l’énergie dont nous dépendons.
Au Québec, cette lecture spatio-temporelle rappelle trois évidences simples :
Notre patrimoine hydroélectrique a façonné le paysage et les mentalités, mais il ne peut à lui seul répondre à la croissance future de la demande?;
Les nouvelles filières renouvelables — solaire, éolien, stockage — ne menacent pas le territoire, mais l’invitent à devenir multifonctionnel : économique, agricole, énergétique et écologique à la fois?;
La proximité, la réversibilité et la temporalité doivent désormais compter autant que la puissance installée dans les critères de planification.
Réduire les émissions de carbone ne suffira pas : il faut aussi réduire la durée et l’intensité de notre emprise sur le territoire. Les technologies capables de coexister, de s’adapter et de disparaître sans traces sont celles qui construiront une énergie vraiment durable.
Annexe — Tableau complet d’usage du sol par filière électrique (ha/TWh/an)
Unités : hectares par TWh d’électricité livrée annuellement (ha/TWh/an). Les chiffres incluent les emprises de transport, les chaînes d’approvisionnement et, le cas échéant, un crédit pour le co-usage.
Définitions des colonnes
Noyau (emprise directe)
Surface strictement occupée par les infrastructures physiques de production : centrale, panneaux, turbines, plateformes, routes internes, postes électriques.
Zone liée au projet
Espace périphérique requis pour la sécurité, l’accès, l’espacement technique ou le fonctionnement, comme les zones d’exclusion nucléaires, les marges solaires ou l’espacement entre éoliennes.
Transport ? sud du Québec
Emprise foncière associée aux lignes de transport nécessaires pour relier la source de production (souvent au nord) aux centres de charge du sud du Québec : corridors 735 kV, 315 kV, postes et emprises.
Chaîne d’approv.
Surface indirectement mobilisée par l’extraction, la transformation, le transport et la logistique des matériaux ou combustibles : mines, pipelines, usines de traitement, terminaux, carrières, selon la filière.
Empreinte avant co-usage
Somme du noyau, de la zone liée au projet, du transport et de la chaîne d’approvisionnement — sans tenir compte des zones partageables.
Co-usage spatial (crédit)
Part de la zone liée au projet pouvant être utilisée simultanément pour d’autres fonctions (agriculture, foresterie, navigation, récréation). Plus ce crédit est élevé, plus l’empreinte réelle diminue.
Empreinte spatiale ajustée
Surface effectivement monopolisée par la filière après déduction du co-usage spatial. C’est l’emprise nette au sol par TWh/an.
Coefficient temporel
Rapport entre la durée totale d’occupation du territoire (construction + production + rémédiation) et la durée productive réelle. Ce coefficient reflète le temps pendant lequel le territoire est occupé sans produire.
Empreinte spatio-temporelle
Empreinte spatiale ajustée multipliée par le coefficient temporel. Il s’agit de la mesure la plus complète : l’occupation réelle du territoire sur l’ensemble du cycle de vie pour chaque TWh d’électricité produite.
Energy is not only a question of carbon, cost, or technology… It’s also about space and time. Each electricity source mobilizes a portion of territory, sometimes visible, sometimes diffuse, over periods that vary greatly between construction, operation, and remediation. These spatiotemporal differences deeply influence the planning, acceptance, and sustainability of our energy choices.
The table below (the full version can be found in the appendix) compares land occupation by generation technology, highlighting the differences in the nature and duration of this occupation. These can be permanent or temporary, exclusive or shared, extractive or reversible.
(Where possible, data and assumptions are based on Québec’s geographic and technical context.)
Summary table — land-use footprint by technology (ha/TWh/year)
Units: hectares per TWh of electricity delivered annually (ha/TWh/year). The figures include transmission rights-of-way, supply chains, and, where applicable, a co-use credit. The full table is presented in the annex. Details of the underlying assumptions are available upon request. One hectare is equivalent to approximately 108,000 sq. ft. or 2.5 acres.
Reservoir hydro has a very large spatiotemporal footprint, but it is very useful because its power is dispatchable, unlike nuclear or run-of-the-river hydro, which operates continuously. Solar and wind remain intermittent, but in Québec the large reservoirs facilitate their integration: the solar electricity produced in the summer makes it possible to keep the water for winter peaks.
These tables show how land occupation differs across electricity sources, and more importantly, how the type and duration of that occupation vary. Large hydroelectric reservoirs and fossil-based systems dominate in both total surface and duration, but their land use is neither as intensive nor as reversible as that of newer technologies.
Methodology
The method to derive these tables follows a progressive approach:
Start from the direct footprint—the physical surface occupied by production infrastructure, then three adjustments are applied to obtain the adjusted footprint.
Add the supply chain and electricity transmission extensions, which represent the upstream and downstream portions of the energy cycle.
Subtractco-use (agricultural, recreational, ecological) to account for shared land.
Adjust for duration of occupation to obtain a net spatiotemporal measure, expressed in hectares per TWh of energy delivered per year.
This method allows an apples-to-apples comparison between technologies with vastly different scales—from a local solar array to a continental hydroelectric complex.
Direct footprint
The direct footprint refers to the physical area occupied by a power plant or generation site. It is the starting point for any comparison, since it reflects the portion of land directly dedicated to energy production—the core site and its project-related zone.
In addition to the core, the direct footprint includes the peripheral areas required for operation or safety. It varies widely across technologies:
For nuclear power, it includes the exclusion and emergency planning zones, which can extend several kilometres around the site.
For coal or gas plants, it includes safety buffers, cooling ponds, and adjacent industrial zones.
For hydroelectricity, it encompasses dams and reservoirs, often permanently flooded.
For wind, it covers turbine spacing and access roads.
For solar, service roads and buffer zones for large solar parks or roof space.
These peripheral areas significantly enlarge the apparent footprint of a project, even if not all land is exclusively occupied. They must, therefore, be considered as an essential component of the direct footprint.
Variation across technologies:
Large hydroelectric projects flood thousands of square kilometres, permanently transforming the landscape.
Thermal and nuclear plants have compact sites concentrated around buildings and security areas.
Wind and solar farms spread over large surfaces, but their physical occupation is low—a small fraction of the ground is built upon.
Three adjustments to the direct footprint
Three key factors refine the direct footprint:
1. Supply chain and transmission — spatial extensions
The real footprint of a technology goes far beyond its generation site. Upstream, it includes material extraction and processing zones; downstream, the transmission networks delivering power to load centres.
This effect is especially significant for Québec’s reservoir-based hydro: 315–735 kV transmission lines can extend hundreds of km, even over 1,500 km, linking northern generating stations to southern demand centres. By contrast, other technologies—solar, wind, thermal—can often be located closer to load centres, even co-located with them.
For fossil and nuclear power, supply chains (mines, pipelines, processing plants) often dominate total footprint, whereas for distributed renewables this contribution is marginal.
2. Co-use — a spatial credit
Co-use applies, to varying degrees, across all technologies.
For onshore wind and vertical bifacial solar, over 80% of the land remains available for agriculture, forestry, or conservation.
For run-of-river hydro, riverbanks and water bodies can be used for navigation, fishing, or recreation.
Thermal and nuclear plants, though more contained, may be surrounded by conservation zones or environmental monitoring areas.
Even hydro reservoirs, though permanent, offer recreational co-use.
In contrast, rooftop solar, while excellent for co-use, remains a real but limited potential, mainly due to the available surface area, geometry and orientation of the roofs. Even if fully mobilized, it can only cover a relatively modest part of the provincial demand.
Co-use, therefore, acts as a spatial credit that reduces the effective footprint of a sector by promoting the integration of other functions in the same territory. It thus becomes an indicator of territorial compatibility between energy and other socio-economic functions.
3. Temporal dimension — prolonged occupation
Finally, the duration of occupation—from construction through remediation—directly affects the true intensity of land use.
Long-cycle technologies (hydro, nuclear, fossil) tie up land for decades or permanently, while renewables like solar and wind have shorter, reversible cycles.
Construction of a dam or thermal plant can take many years, even a decade, while a solar or wind farm can be built in less than two.
At the end of life, fossil and nuclear sites require decades of decommissioning and monitoring, whereas wind or solar facilities can be dismantled or repowered within months.
These three adjustments—supply chain, co-use, and temporality—broaden the concept of land footprint from a raw surface area to a net spatiotemporal occupation.
Hydroelectricity and social acceptability
Hydroelectricity, the cornerstone of Québec’s energy system, stands out for its stability and historical landscape integration, but its reservoirs represent a permanent transformation of land—a legacy that cannot be undone. This model has long enjoyed social acceptance in southern Québec, where hydro is seen as a symbol of modernity and energy sovereignty. However, this is not the case for many northern Indigenous Nations, for whom these projects caused deep territorial and cultural losses and continue to raise issues of recognition, governance, and benefit-sharing.
Vertical co-use: the Beauharnois case
The Beauharnois generating station’s intake canal illustrates how existing infrastructure can serve multiple purposes. This artificial canal, about 25 km long and nearly one kilometre wide (?2,500 ha of water surface), is also part of the St. Lawrence Seaway, serving commercial navigation and water-level regulation. This dual role makes it a striking example of hydraulic and logistical co-use. The same canal could host floating solar panels (floating PV) without impeding hydraulic function or navigation. At a realistic density of 0.5 MW/ha, it could accommodate about 1.2 GW of panels generating 1.5–1.8 TWh per year—nearly 15% of Beauharnois’s current output (11.7 TWh). Such integration would boost production without any new land footprint—a model of technological co-use on already developed territory.
Challenges and perspectives
Land-use analysis highlights three key insights:
The importance of transmission and supply: the farther a source is from load centres, the more significant the land footprint associated with transmission lines becomes. For fossil-fuelled power plants, supply networks (e.g. gas pipelines) must also be considered, which, like the Beauharnois Canal for the St. Lawrence Seaway, represent a substantial portion of the actual spatial footprint of the energy system.
The value of co-use: what matters is not total surface but the project’s ability to share space with other functions.
Reversibility and remediation: newer technologies—wind, solar, storage—stand out for their capacity to release or repurpose land after decommissioning.
Conversely, fossil and nuclear systems leave lasting marks:
Coal mines and ash ponds require decades of environmental monitoring.
Gas wells and pipelines must be sealed and monitored long-term to prevent methane leaks.
Nuclear plants require decades of decommissioning, and waste storage sites remain restricted for generations.
This temporal difference in land occupation — the time during which territory remains effectively committed even after a power plant stops producing — is just as significant as the surface area itself.
Taken together, these elements suggest that, in the long term, the real advantage of wind and solar technologies lies not only in their low emissions, but also in their qualitative spatiotemporal footprint: co-usable, reversible, and limited in duration.
Conclusion
The land footprint of electricity systems is more than a measure of hectares. It tells the story of our collective relationship with territory: what we choose to transform, share, or preserve to produce the energy we rely on.
In Québec, this spatiotemporal perspective reminds us of three simple truths:
Our hydroelectric heritage shaped both landscapes and mindsets, but it alone cannot meet future demand.
New renewable sources—solar, wind, and storage—do not threaten the land; they invite it to become multifunctional: economic, agricultural, energy, and ecological at once.
Proximity, reversibility, and temporality should count as much as installed capacity in planning criteria.
Reducing carbon emissions will not be enough; we must also reduce the duration and intensity of our land footprint. Technologies capable of coexisting, adapting, and disappearing without a trace are those that will build a truly sustainable energy future.
Annex — Detailed Land-Use Table by Generation Technology (ha/TWh/year)
Units: hectares per TWh of electricity delivered annually (ha/TWh/year). The figures include transmission rights-of-way, supply chains, and, where applicable, a co-use credit.
Column Definitions
Core (direct footprint)
The land area strictly occupied by physical production infrastructure: the plant, panels, turbines, platforms, access roads, and substations.
Project-related area
The peripheral land required for safety, access, operational spacing, or technical constraints—for example, nuclear exclusion zones, solar buffer areas, or turbine spacing in wind farms.
Transmission ? southern Québec
The land footprint associated with transmission corridors needed to bring electricity from production sites (often in the North) to load centres in southern Québec: 735-kV and 315-kV corridors, rights-of-way, and substations.
Supply chain
Indirect land use linked to the extraction, processing, transportation, and logistics of materials or fuels: mines, pipelines, processing plants, terminals, quarries—depending on the technology.
Footprint before co-use
The sum of the core footprint, project-related area, transmission, and supply chain — before accounting for areas that can be shared with other land uses.
Spatial co-use (credit)
The portion of the project-related area that can be simultaneously used for other functions (agriculture, forestry, navigation, recreation). A higher co-use credit reduces the effective land footprint.
Adjusted spatial footprint
The net land area effectively monopolized by the energy source after subtracting the co-use credit. Expressed per TWh/year.
Temporal coefficient
The ratio of total land occupation time (construction + production + remediation) to productive time. It reflects how long land remains occupied even when no electricity is being produced.
Spatiotemporal footprint
The adjusted spatial footprint multiplied by the temporal coefficient.
It is the most complete measure, capturing the total land occupation over the full life cycle for each TWh of electricity produced.
Artificial intelligence in utilities has been evolving through complementary techniques such as operational research (OR), machine learning (ML), and, more recently, deep learning (DL), which is the foundation for today’s generative AI (GenAI) systems, like ChatGPT. While discussions about artificial general intelligence (AGI) remain largely speculative, the tools already available are transforming how utilities plan and operate.
I coded systems in the 1980s that, by today’s definitions, would qualify as OR and ML, when OR was already well established but ML was still in its infancy. That early experience does not make me an AI expert, especially today, but it gives me perspective on how technological waves rise, fade, and return in new forms. For utilities, too, the story of AI is less about sudden disruption and more about the gradual evolution of familiar analytical methods.
Operational research has underpinned power systems for generations. Think of t-c curves in substation breakers, under-frequency load shedding (UFLS), optimal power flow, hydro scheduling, outage coordination, logistics, and resource allocation. OR remains the bedrock of transmission operations and planning.
Machine learning was built on that foundation in the 1990s and 2000s. Utilities began using ML for forecasting: load, renewables, and even prices in deregulated markets. Fault detection, predictive maintenance of transformers and cables, and anomaly detection in both physical and cyber domains are all part of this wave.
Deep learning is now emerging and blending into GenAI applications. Drones with computer vision help with vegetation management and line inspections, while natural language processing supports call centres and outage reports. DL and GenAI are also increasingly used in data engineering tasks such as ETL (extract, transform, load) and data validation during IT or OT system upgrades. Large operation manuals running thousands of pages can be loaded into LLMs to provide simplified queries for field staff, reducing the need for extensive retraining. Major technology firms are releasing toolkits designed to assist with these tasks, such as Google’s AI agents for data teams. These tools can accelerate integration but still depend on strong data governance and domain expertise.
AGI is the theoretical next step. But utilities should not chase AGI for its own sake. The practical gains come from systems tailored to grid management, customer service, and asset health, concrete problems that demand explainable and regulator-ready solutions.
Many utilities have been reluctant to adopt even proven OR or ML applications. Preventive maintenance, for example, has often been skipped in favour of run-to-failure strategies. The hesitation is not purely technical: weak data governance, inadequate telecommunications, and cultural or regulatory conservatism have all contributed to slow uptake. Paradoxically, these same approaches are sometimes embraced more readily once rebranded under the banner of AI. Yet the true test for utilities is not technological; it is organizational, requiring management, governance, and training that match the pace of innovation.
There are also risks of errors, especially with generative AI (GenAI) and large language models (LLMs). These systems, built on deep learning, can generate text, code, or answers to queries, making them powerful tools for simplifying information access. However, I use GenAI systems myself for writing, and they can speed up the first 80% of the work, but they still make mistakes. That is acceptable for drafting texts reviewed by a knowledgeable human, but not for mission-critical systems where safety and reliability are paramount.
Data Challenges
A real constraint for utilities is not algorithms but data quality and management. Transmission networks are relatively well-instrumented, but distribution networks are messy: millions of dispersed assets, fragmented records, and legacy systems. As distributed energy resources (DERs) and smart meters multiply, the volume of data explodes. Governance, interoperability, and cybersecurity must come first. Poor data quality also limits AI training and model validation, making good data management a prerequisite for credible results. DL and GenAI tools can assist with data cleaning and integration, but only if strong frameworks are in place.
Workforce and Implementation Challenges
Utilities are reliability-driven and risk-averse, understandably so. But that culture makes adopting digital tools difficult. AI projects require hybrid skills: expertise in power systems and in AI models. Workforce retraining and AI literacy are essential. Change management is often the biggest barrier. Another obstacle is the limited willingness to experiment. Unlike technology firms that dedicate teams to test and iterate new tools, most utilities hesitate to invest in projects whose outcomes are uncertain, even when the learning value is high. Some tasks can indeed be simplified without much training; LLMs answering queries from massive technical manuals are a good example, but most require deeper integration into existing practices.
Regulators will also demand transparency. If AI is used for outage prioritization or rate optimization, the decisions must be explainable. Some approaches, such as OR and many ML models, are relatively transparent in how results are derived, while deep learning and LLMs often function as “black boxes”, making it harder to justify their outputs. Explainability matters not just for model quality but also for public trust, regulatory compliance, and the ability to audit decisions that affect reliability and customer outcomes. Blind faith in vendor promises of “AI magic” will not withstand regulatory or operational scrutiny. In fact, utilities often place more trust in the real-world experiences of peer utilities than in vendor marketing. Vendors that succeed will be those who act as patient knowledge bridges, bringing lessons and insights from other utilities worldwide on how AI has been deployed effectively, not just selling technology.
New Electricity Demand
AI is not just a solution; it also drives new electricity demand. Large AI data centres now consume electricity at levels comparable to an aluminum smelter. This rising load adds pressure on already constrained grids. There are also concerns about where the data is stored: if critical data is kept in foreign countries or may be required to be provided to foreign governments, questions of sovereignty, security, and regulatory compliance arise.
The Way Forward
The next stage for utilities is not about chasing AGI. It is about becoming AI-ready organizations by focusing on:
Strengthening data governance and interoperability
Managing IT/OT projects with discipline
Building workforce skills in AI and data literacy
Prioritizing explainability and regulator-ready solutions
AI will not replace the fundamentals of electricity, such as safety, reliability, and efficiency, but it can enhance them. The challenge is less about algorithms than about how utilities manage their data, infrastructure, and people. The utilities that master data and governance today will be the ones shaping how AI transforms the grid tomorrow.
L’intelligence artificielle dans les compagnies d’électricité évolue depuis des décennies à travers des techniques complémentaires, comme la recherche opérationnelle (Operational Research, OR), l’apprentissage automatique (Machine Learning, ML) et, plus récemment, l’apprentissage profond (Deep Learning, DL), qui constitue la base des systèmes actuels d’IA générative (GenAI), tels que ChatGPT. Bien que les discussions sur l’intelligence artificielle générale (AGI) restent largement spéculatives, les outils déjà disponibles transforment la manière dont les compagnies d’électricité planifient et exploitent leurs réseaux.
J’ai conçu des systèmes dans les années 1980 qui, selon les définitions actuelles, seraient considérés comme de la recherche opérationnelle et de l’apprentissage automatique, à une époque où la première était déjà bien établie, mais où le second en était encore à ses débuts. Cette expérience précoce ne fait pas de moi un expert en IA, surtout aujourd’hui, mais elle me donne une perspective sur la façon dont les vagues technologiques montent, retombent et reviennent sous de nouvelles formes. Pour les compagnies d’électricité aussi, l’histoire de l’IA relève moins d’une rupture soudaine que d’une évolution graduelle de méthodes analytiques bien connues.
La recherche opérationnelle soutient les systèmes électriques depuis des générations. Pensons aux courbes t?c des disjoncteurs de postes, au délestage de charge en cas de sous?fréquence (Under Frequency Load Shedding, UFLS), à l’optimisation des flux de puissance, à la planification hydroélectrique, à la coordination des arrêts, à la logistique et à l’allocation des ressources. L’OR demeure la base des opérations et de la planification du transport.
L’apprentissage automatique s’est appuyé sur cette base dans les années 1990 et 2000. Les compagnies d’électricité ont commencé à l’utiliser pour la prévision : charge, production renouvelable et même prix sur les marchés déréglementés. La détection de pannes, la maintenance prédictive des transformateurs et câbles, ainsi que la détection d’anomalies dans les domaines physique et cybernétique, font partie de cette vague.
L’apprentissage profond émerge aujourd’hui et se combine aux applications de GenIA. Les drones dotés de vision artificielle aident à la gestion de la végétation et à l’inspection des lignes, tandis que le traitement du langage naturel soutient les centres d’appels et les rapports de pannes. Le DL et la GenAI sont également de plus en plus utilisés pour des tâches d’ingénierie des données, comme les processus ETL (extraire, transformer, charger) et la validation de données lors de la modernisation des systèmes informatiques (TI) ou opérationnels (TO). Les manuels d’exploitation de plusieurs milliers de pages peuvent être intégrés à des modèles de langage (Large Language Models, LLM) afin de fournir des réponses simplifiées au personnel de terrain, réduisant ainsi le besoin de formation approfondie. De grandes entreprises technologiques publient des outils conçus pour aider à ces tâches, comme les agents d’IA de Google destinés aux équipes de données. Ces outils peuvent accélérer l’intégration, mais reposent toujours sur une gouvernance rigoureuse des données et une expertise métier solide.
L’AGI constitue l’étape théorique suivante. Cependant, les compagnies d’électricité ne devraient pas la poursuivre pour elle-même. Les gains pratiques proviennent de systèmes adaptés à la gestion du réseau, au service à la clientèle et à la santé des actifs — des problèmes concrets qui exigent des solutions explicables et conformes aux exigences réglementaires.
De nombreuses compagnies d’électricité ont hésité à adopter même des applications éprouvées d’OR ou de ML. La maintenance préventive, par exemple, a souvent été écartée au profit de stratégies d’exploitation jusqu’à la défaillance. Cette réticence n’est pas uniquement technique : une gouvernance des données faible, des télécommunications inadéquates et un conservatisme culturel ou réglementaire ont tous contribué à ce retard. Paradoxalement, ces mêmes approches sont parfois adoptées plus facilement lorsqu’elles sont présentées sous l’étiquette «?IA?». Le véritable défi pour les compagnies d’électricité n’est donc pas technologique, mais organisationnel, nécessitant une gestion, une gouvernance et une formation à la hauteur du rythme de l’innovation.
Les systèmes d’IA générative (GenAI) et les grands modèles de langage (LLM) comportent également des risques d’erreurs. Ces systèmes, fondés sur l’apprentissage profond, peuvent générer du texte, du code ou des réponses à des requêtes, ce qui en fait des outils puissants pour simplifier l’accès à l’information. Toutefois, je les utilise moi?même pour l’écriture, et s’ils accélèrent les 80 % initiaux du travail, ils font encore des erreurs. Cela peut convenir pour la rédaction de texte révisé par un humain averti, mais pas pour les systèmes essentiels à la mission, où la sécurité et la fiabilité priment.
Défis liés aux données
La principale contrainte pour les compagnies d’électricité ne réside pas dans les algorithmes, mais dans la qualité et la gestion des données. Les réseaux de transport sont relativement bien instrumentés, mais les réseaux de distribution sont complexes : millions d’actifs dispersés, dossiers fragmentés et systèmes hérités. À mesure que se multiplient les ressources énergétiques distribuées (Distributed Energy Resources, DER) et les compteurs intelligents, le volume de données explose. La gouvernance, l’interopérabilité et la cybersécurité doivent passer en premier. Une mauvaise qualité de données limite aussi l’entraînement et la validation des modèles d’IA, ce qui fait de la gestion des données une condition préalable à des résultats crédibles. Le DL et la GenAI peuvent contribuer à nettoyer et à intégrer ces données, mais seulement si des cadres solides sont en place.
Défis organisationnels et de mise en œuvre
Les compagnies d’électricité sont axées sur la fiabilité et la prudence, à juste titre. Mais cette culture rend l’adoption des outils numériques difficile. Les projets d’IA exigent des compétences hybrides : expertise en systèmes électriques et en modèles d’IA. La requalification et la culture numérique sont essentielles. La gestion du changement constitue souvent le principal obstacle. Un autre frein est la faible tolérance à l’expérimentation. Contrairement aux entreprises technologiques qui consacrent des équipes entières à tester et itérer de nouveaux outils, la plupart des compagnies d’électricité hésitent à investir dans des projets dont les résultats sont incertains, même lorsque la valeur d’apprentissage est élevée. Certaines tâches peuvent être simplifiées sans beaucoup de formation?; les LLM capables de répondre à des requêtes à partir de manuels techniques volumineux en sont un bon exemple, mais la plupart nécessitent une intégration plus profonde aux pratiques existantes.
Les organismes de réglementation exigeront également de la transparence. Si l’IA est utilisée pour prioriser les pannes ou optimiser les tarifs, les décisions devront être explicables. Certaines approches, comme l’OR et de nombreux modèles de ML, sont relativement transparentes dans leurs résultats, tandis que l’apprentissage profond et les LLM fonctionnent souvent comme des «?boîtes noires?», rendant la justification plus difficile. L’explicabilité est essentielle non seulement pour la qualité des modèles, mais aussi pour la confiance du public, la conformité réglementaire et la capacité d’auditer les décisions qui affectent la fiabilité et le service aux clients. La foi aveugle dans les promesses d’«?IA magique?» ne résistera pas à l’examen réglementaire ou opérationnel. En fait, les compagnies d’électricité font souvent davantage confiance à l’expérience réelle de leurs pairs qu’au marketing des fournisseurs. Les fournisseurs qui réussiront seront ceux qui agiront comme des ponts de connaissance patients, apportant les leçons et les perspectives d’autres compagnies d’électricité à travers le monde sur la façon dont l’IA a été déployée efficacement, plutôt que de simplement vendre de la technologie.
Nouvelle demande en électricité
L’IA n’est pas seulement une solution?; elle crée aussi une nouvelle demande d’électricité. Les grands centres de données d’IA consomment désormais de l’électricité à des niveaux comparables à ceux d’une aluminerie. Cette charge croissante accentue la pression sur des réseaux déjà sollicités. S’ajoutent les préoccupations quant à l’endroit où les données sont stockées : si des données critiques sont conservées à l’étranger ou susceptibles d’être partagées avec des gouvernements étrangers, des questions de souveraineté, de sécurité et de conformité réglementaire se posent.
La voie à suivre
La prochaine étape pour les compagnies d’électricité ne consiste pas à courir après l’AGI, mais à devenir de véritables organisations prêtes pour l’IA en se concentrant sur :
le renforcement de la gouvernance et de l’interopérabilité des données?;
la gestion rigoureuse des projets TI/TO?;
le développement des compétences de la main?d’œuvre en IA et en culture des données?;
la priorité donnée à l’explicabilité et à la conformité réglementaire.
L’IA ne remplacera pas les fondements de l’électricité, comme la sécurité, la fiabilité et l’efficacité, mais elle peut les renforcer. Le défi tient moins aux algorithmes qu’à la manière dont les compagnies d’électricité gèrent leurs données, leurs infrastructures et leurs équipes. Ceux qui maîtriseront la gouvernance et la qualité des données aujourd’hui seront ceux qui façonneront la manière dont l’IA transformera le réseau de demain.
J’ai récemment lu How Big Things Get Done de Prof. Bent Flyvbjerg et Dan Gardner. C’est un livre fascinant, à la fois érudit et accessible, qui plonge dans le monde des grands projets d’infrastructure. Dans cet ouvrage, les auteurs analysent une base de données comprenant plus de 16?000 projets, et démontrent, à l’aide de statistiques, que la plupart d’entre eux dépassent leur budget et leur échéancier, parfois de manière spectaculaire.
Je n’ai jamais dirigé de mégaprojet de l’ampleur de ceux décrits dans le livre. Le plus grand projet dont j’ai eu la responsabilité atteignait environ cent millions de dollars. C’est déjà imposant pour une équipe, mais bien loin des dizaines de milliards des projets de barrages, de centrales nucléaires ou des Jeux olympiques étudiés par Flyvbjerg. Cela ne m’a pas empêché d’être curieux de voir ce que je pourrais en tirer, et j’y ai trouvé des enseignements applicables, même à plus petite échelle.
Le constat n’est pas que tout est condamné à l’échec, mais que certains types de projets réussissent beaucoup mieux que d’autres. Les messages clés sont clairs : la modularité est puissante et il faut penser lentement, agir rapidement. Lorsqu’un projet peut être découpé en modules répétitifs et standardisés, comme c’est le cas pour le solaire ou les batteries, les risques chutent. À l’inverse, les projets uniques, massifs et fortement innovants, comme les grands barrages hydroélectriques ou le nucléaire, accumulent les dangers de dépassements. Flyvbjerg note qu’un pourcentage d’entre eux sont des projets à «?fat tail?», dont la distribution des risques est asymétrique : la partie droite de la courbe est plus lourde que dans une distribution normale, ce qui accroît fortement la probabilité de dépassements extrêmes de coûts ou de délais.
Intrigué, j’ai voulu voir où se situe Hydro Québec dans ce portrait. Mon intuition était que l’entreprise faisait mieux que la moyenne mondiale, car elle a construit en série des barrages pendant des décennies, accumulant une expertise institutionnelle rare. L’analyse des nouvelles centrales mises en services dans les 25 dernières années confirme cette intuition : alors que la moyenne mondiale des dépassements pour les barrages est d’environ +75 % dans la base de données de Flyvbjerg, le bilan d’Hydro-Québec apparaît beaucoup plus modéré.
La centrale Sainte-Marguerite-3, mise en service en 2003, avec ses innovations risquées (grands groupes turboalternateurs assemblés sur place, construction souterraine), a connu de graves difficultés techniques et fût l’un des projets le plus ardus des dernières décennies. Les sources publiques indiquent un coût de construction d’environ 2,5 milliards de dollars, pas très au-dessus de l’estimation initiale, car plusieurs déficiences étaient sous garantie, mais la mise en service a été retardée de 2 ans par rapport à l’échéancier et les problèmes prolongés ont fait en sorte que la pleine capacité n’a été atteinte qu’en 2007, suivie d’un nouveau bris en 2009. Ces retards ont créé un coût d’opportunité, puisque l’électricité attendue n’a pas pu être livrée. Selon les hypothèses sur la production perdue et les prix de l’électricité, ce coût d’opportunité pourrait atteindre quelques centaines de millions de dollars, un dépassement qui n’apparaît pas dans les comptes de construction, mais qui reste limité à environ 20 ou 25 % du coût de construction, largement moins que la moyenne des dépassements calculée par Flyvbjerg.
Pour des centrales comme Eastmain-1A et Sarcelle (mises en service entre 2011 et 2013) et Romaine-1 à -3 (mises en service entre 2014 et 2017), l’information sur les coûts est moins précise, mais aucun écart majeur n’a été rapporté.
Le projet Romaine-4, mis en service en 2022, en retard d’un an, a été plus difficile, avec des difficultés techniques (comme la friabilité du roc) et la pandémie de COVID-19. Le coût total de la réalisation du complexe de la Romaine s’est élevé à 7,4 milliards de dollars, soit seulement 14 % de plus que l’estimation initiale. Cependant, Romaine-4 a été la principale cause des dépassements de budget.
Globalement, la performance d’Hydro-Québec est bien meilleure que la moyenne mondiale pour la catégorie hydroélectrique de Flyvbjerg, même en incluant les projets difficiles qu’ont été Sainte-Marguerite-3 et La Romaine-4.
Cette particularité québécoise est probablement due à ce qu’on appelle l’«?effet de série?» : sept nouvelles centrales ont été mises en service au cours des 25 dernières années. Quand les ingénieurs passent d’un chantier à l’autre, la mémoire organisationnelle compense une partie du risque. Cet effet de série s’étend aussi à la chaîne d’approvisionnement, solide au Québec, avec des turbiniers (Voith Hydro, ANDRITZ Hydro, GE Vernova, Litostroj Hydro) et de grands entrepreneurs (comme Pomerleau), appuyés par un écosystème complet de manufacturiers internationaux (comme Hitachi Energy et Schneider Electric) et de nombreuses PME locales. Cet écosystème encore trop méconnu du grand public est l’un des joyaux industriels du Québec et un facteur clé du succès d’Hydro-Québec. Il faut toutefois rappeler que le risque de dépassement demeure réel, et que les projets d’Hydro-Québec ne sont pas à l’abri. Ce risque pourrait même croître avec le ralentissement probable du rythme de construction, même si une partie de l’expertise est appelée à perdurer grâce aux travaux de réfection déjà en cours sur les centrales existantes.
Le contraste est quand même frappant avec les projets solaires, qui affichent dans la base de Flyvbjerg des dépassements pratiquement nuls. Ces technologies, qui sont intrinsèquement modulaires, faciles à mettre en œuvre et prévisibles en termes de coûts, doivent être intégrées à l’arsenal québécois. Développer une expertise locale dans ces filières n’est pas un luxe : c’est une nécessité si l’on veut maîtriser les risques tout en répondant aux besoins d’électrification.
How Big Things Get Done se lit à la fois comme un avertissement et comme un guide pratique. Le Québec a bâti son histoire énergétique sur des mégaprojets hydroélectriques qui l’ont distingué dans les statistiques mondiales. Pour l’avenir, il faudra sans doute conjuguer cette tradition avec l’esprit de modularité du solaire et du stockage. Penser lentement, agir rapidement — et choisir les bons outils pour les grandes choses à venir.
I recently read How Big Things Get Done by Prof. Bent Flyvbjerg and Dan Gardner . It’s a fascinating book, both scholarly and accessible, that dives into the world of large infrastructure projects. The authors analyze a database of more than 16,000 projects and demonstrate, with data, that most exceed their budgets and schedules, sometimes dramatically.
I have never directed a megaproject on the scale described in the book. I led a team on a project worth over $100 million. While this was a significant endeavour, it paled in comparison to the billions invested in projects such as dams, nuclear power plants, or the Olympic Games, as analyzed by Flyvbjerg. Still, I was curious to see what I could take away, and I found lessons that apply even at smaller scales.
The point is not that everything is doomed to fail, but that some types of projects succeed much more often than others. The key messages are clear: modularity is powerful and think slow, act fast. When a project can be broken into repetitive, standardized modules—as is the case for solar or batteries—risks drop sharply. In contrast, unique, massive, and highly innovative undertakings, like hydroelectric dams or nuclear plants, accumulate risks of cost and schedule overruns. Flyvbjerg notes that a percentage of these are “fat tail” projects, where risk distributions are skewed: the right side of the curve is much heavier than in a normal distribution, making extreme cost or time overruns far more likely.
Intrigued, I wanted to see how Hydro Québec fits into this picture. My intuition was that the company performs better than the global average, because it has built dams in series for decades, accumulating rare institutional expertise. An analysis of new plants commissioned in the past 25 years confirms this intuition: while the global average overrun for dams is about +75% in Flyvbjerg’s database, Hydro-Québec’s record appears much more moderate.
Sainte-Marguerite-3, commissioned in 2003, with its risky innovations (large turbine-generator units assembled on site, underground construction), faced serious technical difficulties and was one of the toughest projects of the past few decades. Public sources indicate a construction cost of about $2.5 billion, not far above the original estimate, since many deficiencies were under warranty. But commissioning was delayed by two years, and extended problems meant that full capacity was only reached in 2007, followed by another breakdown in 2009. These delays created an opportunity cost, since the expected electricity could not be delivered. Depending on assumptions about lost output and electricity prices, this opportunity cost could amount to several hundred million dollars—a hidden overrun not reflected in construction accounts, but still limited to about 20 to 25% of construction costs, well below the average overruns measured by Flyvbjerg.
For plants like Eastmain-1A and Sarcelle (commissioned between 2011 and 2013) and Romaine-1 to -3 (commissioned between 2014 and 2017), cost information is less precise, but no major overruns have been reported.
Romaine-4, commissioned in 2022, was more difficult, with technical challenges (such as friable rock) and the COVID-19 pandemic. The total cost of the Romaine complex reached $7.4 billion, only 14% above the initial estimate. Romaine-4 was the main cause of that overrun.
Overall, Hydro-Québec’s performance is far better than the global average for hydro projects in Flyvbjerg’s database, even when including challenging projects such as Sainte-Marguerite-3 and Romaine-4.
This Québec exception is likely explained by the “series effect”: seven generating stations were commissioned in the last 25 years. When engineers move from one site to the next, organizational memory offsets part of the risk. The series effect also extends to the supply chain, strong in Québec, with turbine manufacturers (Voith Hydro, ANDRITZ Hydro, GE Vernova, Litostroj Hydro) and major contractors (such as Pomerleau ), supported by a complete ecosystem of international manufacturers (such as Hitachi Energy and Schneider Electric) and numerous local SMEs. This ecosystem, still too little known to the public, is one of Québec’s industrial jewels and a key factor in Hydro-Québec’s success. Still, the risk of overruns remains real, and Hydro-Québec’s projects are not immune. This risk may even grow as the pace of new construction slows, although part of the expertise will persist through refurbishment work already underway on existing plants.
Nevertheless, the contrast with solar projects is striking: Flyvbjerg’s database shows that they have almost no overruns. These technologies, naturally modular, quick to deploy, and predictable in cost, must be part of Québec’s toolbox. Developing local expertise in these fields is not a luxury; it is a necessity if we want to manage risks while meeting electrification needs.
How Big Things Get Done reads both as a warning and as a practical guide. Québec built its energy history on hydro megaprojects that set it apart in global statistics. For the future, it will likely need to combine that tradition with the modular spirit of solar and storage. Think slow, act fast—and choose the right tools for the big things to come.
I recently returned from a stay in the Magdalen Islands in the Gulf of St. Lawrence. Behind the beauty of the landscapes lies a unique energy reality: both pragmatic and fragile.
Energy on the Islands is still dominated by fossil fuels: diesel for boats and trucks, gasoline for cars, large marine diesel engines for the Cap-aux-Meules power plant, and heating oil for homes.
Photos: Ferry; Heating oil tank; Fuel tanks; Port of Cap-aux-Meules
Two wind turbines punctuate the landscape. They symbolize a willingness to diversify, but also local resistance to change perceived as imposed “from the mainland”. Unlike Prince Edward Island, which I passed on the way to the ferry, I saw no solar panels in the Magdalen Islands. On PEI, solar panels are already visible in the landscape and part of everyday life, accentuating the contrast.
Enercon E126 EP3 wind turbine and my campervan to have a sense of scale
A local economy anchored in diesel
The Cap-aux-Meules plant runs on large 12 MW marine diesel engines. These are the same types of engines found in many power plants across Africa and other remote regions of the world: reliable, robust, but rigid. They cannot easily adjust to variations in wind power.
Cap-aux-Meules power plant
Maintaining them requires specialized mechanics, often trained in maritime trades. These stable jobs are essential in a local economy marked by the seasonality of tourism and fishing. Replacing diesel with renewables does not recreate the same job base. And that is the core dilemma: energy transition is not just about replacing megawatts, it must also work with existing economic and social structures.
Between renewables and network rigidity
Integrating renewables runs up against this reality. The two existing turbines produce electricity, but their contribution is constrained by the inflexible thermal fleet. The absence of residential or commercial solar reinforces the impression of a system locked in its traditional model, despite potential and inspiring examples elsewhere.
Hydro-Québec’s plan (June 2025)
Hydro-Québec recently announced a strategy to reshape the Islands’ energy supply:
A new 16.8 MW wind farm on Grosse-Île, expected to cut diesel use by 40%.
A residential and commercial solar program starting in 2026 (covering up to 50% of installation costs).
A new low-carbon fuel power plant by 2035, designed to maintain local jobs.
A $70M efficiency program, including widespread deployment of heat pumps.
This plan addresses social and technical constraints, but it isn’t very innovative. One might have hoped for more: experiments with storage, pilot microgrids, or bolder solutions like those seen in other islands.
Transport and heating: small but concrete steps
I saw a few electric cars. Like heat pumps, each replacement reduces imported fuel consumption and emissions, even if the electricity still comes mainly from fossil fuels. In a temperate climate, the efficiency gains are significant.
The Orkney contrast
Across the Atlantic, the Orkney Islands (Scotland) chose a different path: go big on renewables (wind, tidal, solar), then invent solutions to balance the grid with storage and green hydrogen. In the Magdalen Islands, the approach remains cautious and traditional: secure energy with a thermal base, and gradually add renewables. Two opposite logics, both valid in their respective contexts.
Madelinots facing climate change
Residents don’t need theory: they already live with climate impacts. Coastal erosion is everywhere, entire homes are protected by rock armouring, and the disappearance of sea ice worsens winter storms. Their carbon footprint is tiny, but their vulnerability immense.
Houses protected by a rock wall
A universal contrast: pragmatism vs idealism
This contrast between pragmatism (Michael Liebreich) and idealism (Greta Thunberg) is not unique to the Islands. It is found everywhere the transition threatens established practices or entrenched orders. Think of Alberta: facing climate-driven wildfires, yet still dependent on oil exploitation.
Conclusion – Politics as the art of the possible
From the mainland, the contradictions seem obvious: acknowledging climate change while relying on diesel. But the Islands’ energy transition must be built with, and for, their residents.
Hydro-Québec’s strategy charts a pragmatic course: diversify supply, cut emissions, and preserve local jobs. Yet for a territory so exposed and symbolic, perhaps more boldness was needed.
Je reviens d’un séjour aux Îles-de-la-Madeleine, dans le golfe du St-Laurent. Derrière la beauté des paysages, on découvre une réalité énergétique unique, à la fois pragmatique et fragile.
L’énergie aux Îles est encore dominée par les combustibles fossiles : diesel pour les bateaux et les camions, et essence pour les voitures, gros moteurs maritimes pour la centrale thermique de Cap-aux-Meules, mazout pour le chauffage.
Photos: traversier; réservoir de mazout; réservoirs de carburant; port de Cap-aux-Meules.
Deux éoliennes ponctuent le paysage. Elles symbolisent une volonté de diversification, mais aussi les résistances locales face à un changement perçu comme imposé « du continent ». Contrairement à l’Île-du-Prince-Édouard, visitée sur le chemin du traversier, je n’ai vu aucun panneau solaire aux Îles. Sur l’Î.-P.-É., les panneaux sont déjà visibles dans le paysage et intégrés dans la vie quotidienne, ce qui accentue le contraste.
Éolienne Enercon E126 EP3 et mon campeur pour donner l’échelle
Une économie locale ancrée dans le diesel
La centrale de Cap-aux-Meules fonctionne avec de gros moteurs diesel maritimes de 12 MW. Ce sont les mêmes types de moteurs que l’on retrouve dans de nombreuses centrales en Afrique ou dans d’autres régions isolées du monde : fiables, robustes, mais rigides. Ils ne peuvent pas s’ajuster rapidement aux variations de l’éolien.
Centrale de Cap-aux-Meules
Leur entretien mobilise des mécaniciens spécialisés, souvent formés dans le milieu maritime. Ces emplois stables sont essentiels dans une économie locale marquée par la saisonnalité du tourisme et de la pêche. Remplacer le diesel par des énergies renouvelables ne recrée pas le même tissu d’emplois. Et c’est là tout le dilemme : la transition énergétique ne se limite pas à remplacer des mégawatts, elle doit aussi composer avec les structures économiques et sociales existantes.
Entre renouvelables et rigidité du réseau
L’intégration des énergies renouvelables se heurte directement à cette réalité. Les deux éoliennes actuelles produisent de l’électricité, mais leur contribution est limitée par la rigidité du parc thermique. L’absence de solaire résidentiel ou commercial renforce cette impression d’un système qui reste enfermé dans son modèle traditionnel, malgré le potentiel et les exemples inspirants observés ailleurs.
Le plan d’Hydro-Québec (juin 2025)
Hydro-Québec a récemment annoncé une stratégie pour transformer l’approvisionnement énergétique des Îles :
Un nouveau parc éolien de 16,8 MW à Grosse-Île, qui réduira de 40 % la consommation de diesel.
Un programme solaire résidentiel et commercial dès 2026 (jusqu’à 50 % du coût couvert).
Une nouvelle centrale à carburant à faible intensité en carbone d’ici 2035 pour maintenir des emplois locaux.
Un programme d’efficacité énergétique de 70 M$, incluant le déploiement massif de thermopompes.
Ce plan répond aux contraintes sociales et techniques, mais il n’est pas très innovant. On aurait pu espérer davantage : expérimentations avec le stockage, projets pilotes de microgrids hybrides, solutions plus audacieuses, comme on en voit dans d’autres îles.
Transport et chauffage : de petits pas concrets
J’ai vu quelques voitures électriques. Comme pour les thermopompes, chaque remplacement réduit la consommation de carburant importé et les émissions, malgré l’électricité de source fossile, surtout dans un climat tempéré qui maximise les gains d’efficacité.
Le contraste avec les Orkney
À l’autre bout de l’Atlantique, les îles Orkney (Écosse) ont pris une voie différente : miser massivement sur le renouvelable (éolien, marée, solaire), puis inventer des solutions pour équilibrer le réseau avec du stockage et de l’hydrogène vert. Aux Îles-de-la-Madeleine, l’approche reste prudente et traditionnelle : sécuriser l’énergie avec une base thermique, et intégrer progressivement des renouvelables. Deux logiques opposées, toutes deux légitimes selon les contextes.
Les Madelinots face aux changements climatiques
Les habitants n’ont pas besoin d’explications théoriques : ils vivent déjà les effets du climat. L’érosion côtière est visible partout, des maisons entières sont protégées par des enrochements artificiels, et la disparition du couvert de glace aggrave les tempêtes hivernales. Leur empreinte carbone est minuscule, mais leur vulnérabilité est immense.
Maisons protégées par enrochement
Un contraste universel : pragmatisme vs idéalisme
Ce contraste entre pragmatisme (à la Michael Liebreich) et idéalisme (à la Greta Thunberg) n’est pas exclusif aux Îles. On le retrouve partout où la transition menace les façons de faire ou l’ordre établi. Pensons à l’Alberta : confrontée aux feux de forêt liés au climat, mais toujours dépendante de l’exploitation pétrolière.
Conclusion – La politique est l’art du possible
Vues du continent, les contradictions semblent évidentes : reconnaître les changements climatiques tout en continuant à dépendre du diesel. Mais la transition énergétique des Îles doit se construire avec et pour leurs habitants.
La stratégie d’Hydro-Québec trace une voie pragmatique : diversifier les sources, réduire les GES, tout en préservant l’économie locale. Mais pour un territoire aussi exposé et symbolique, on aurait peut-être aimé plus d’audace.
Canada’s automotive sector is at an inflection point. With CEOs urging Ottawa to soften the ZEV mandate, U.S. policy diverging, and tariffs reshaping trade, the question is how Canada stays competitive now while preparing for an electric future. This article sets out a plan that is robust in the first years and scalable thereafter.
Electrification is the direction of travel. According to the International Energy Agency’s Global EV Outlook 2024, global EV sales have already surpassed pre?pandemic growth trends and are projected to reach over 60% of global sales by 2035 under stated policies. BloombergNEF and IEA data indicate that global peak ICE sales occurred between 2017 and 2019, with volumes now in structural decline—a trend likely to accelerate as charging networks expand. This turning point means delaying action would be costly to reverse. Staying the course on electrification can deliver major payoffs in investment certainty, supply?chain anchoring, and public?health and consumer cost savings. The strategic prize is to be ready when the world, including the U.S., decisively turns electric.
Automaker CEOs in Canada have urged Ottawa to repeal the ZEV mandate in private letters and meetings with the Prime Minister, as reported by CBC News and Bloomberg in mid?2025, and I understand why. If the U.S. weakens vehicle emissions rules and shifts capital back to internal combustion trucks and SUVs while Canada keeps its focus on EVs, we risk losing integration with the North American EV supply chain and its economies of scale.
However, stepping off the mandate would lock in higher emissions and leave Canada behind Europe and Asia, where policy remains firm despite tighter trade defences.
Add Mexico to the picture. Mexico is a top vehicle exporter benefiting from nearshoring. If the U.S. EV push slows, Mexico can still attract EV and component investment for Latin America and beyond. Partnering on materials?to?modules value chains preserves North American scale and positions both countries to accelerate when U.S. policy shifts.
Data point: In June 2025, Canada imported about C$1.08 billion in passenger vehicles from Mexico versus ~C$950 million from the U.S., the first month Mexico led by value; this supports a Canada—Mexico pipeline while U.S. policy is uncertain.
Two plausible paths
Short separation (2–4 years): the U.S. realigns EV rules and incentives, restoring continental scale.
Long separation (5–10 years): tariffs and policy divergence persist, with Canada and Mexico carrying more of the regional EV momentum.
Because these two scenarios diverge only after a few years, the early stage must be the same: a no?regret plan that works under either path.
First three years: no?regret plan
Keep the ZEV trajectory with flexibility: allow credit banking and limited borrowing, and offer a transitional, declining PHEV credit tied to real-world electric use.
Strengthen demand clarity and infrastructure: restore predictable point-of-sale incentives aligned with vehicle efficiency and battery sustainability (carbon footprint and responsible sourcing), and expand public charging and residential retrofit charging to reassure consumers.
Secure continental scale: build a Canada—Mexico pipeline ahead of the 2026 CUSMA review on rules of origin, charging standards, logistics, and a shared battery passport.
Anchor supply chain investment: lock in platform agreements (production allocations, shared R&D, or supply deals) with European, Chinese, Japanese, and Korean OEMs, and secure long-term contracts for critical minerals and recycling.
Years 4–10: actions by path At year three, the plan forks by path.
If U.S. policy realigns by 2028 (short separation):
Phase out the PHEV bridge; sunset credit borrowing by 2030.
Tighten banking limits and prioritize Canada—U.S. content and cross?border EV corridors.
Harmonize charging, payments, and data; recognize credits reciprocally to speed scale?up.
If separation persists for 5–10 years (long separation):
Create a ring?fenced Canada—Mexico compliance lane with higher credit multipliers for compliant content.
Deepen domestic midstream battery supply chain (cathode/anode, motors, power electronics, software) and fast?track grid connections.
Maintain finished?vehicle guardrails while selectively opening component/tooling channels with strict security and traceability; build export routes to the EU and Latin America.
Policy coherence and stability
These principles underpin both plausible paths and should guide choices regardless of how U.S. policy evolves. They also highlight a structural challenge: unlike China’s centralized model, Canada’s democratic process requires consultation, debate, and compromise—making coherence harder but legitimacy stronger.
Align domestic measures through structured consultation, transparent impact assessments, and parliamentary debate to strengthen social acceptability.
Anchor EV and supply-chain rules in international agreements (e.g. Canada—Mexico, Canada—EU, Canada—Japan). These bring greater certainty than domestic policy alone, which a future government could reverse.
Guardrails on Chinese partnerships must be explicit: technology transfer, royalties, and sourcing transparency, so cooperation does not turn into dependency.
Investors need stable rules. Policy whiplash deters financing more than ambitious targets.
Why this balance matters
The payoff: Be ready when the world, including the U.S., decisively turns electric, earning priority for platform allocations, supplier investment, and export corridors.
The mandate provides investment certainty and built?in flexibility to reduce compliance risk if the U.S. market slows. At the same time, strong supply?chain commitments position Canada as a core of the EV ecosystem, ready to scale when the cycle turns.
Predictable point-of-sale incentives, together with visible investment in public charging networks and support for residential retrofit charging, sustain consumer demand and give buyers confidence that EV ownership is practical and convenient.
Guardrails and a Canada—Mexico compact preserve resilience, balancing global competition with regional stability.
Canada need not choose between ambition and realism, or between continental integration and diversification via Mexico. We can hold the line on outcomes, adapt the path, and be ready to lead when North American politics shift and the market decisively turns electric.
Le secteur automobile canadien est à un point d’inflexion. Alors que des PDG pressent Ottawa d’assouplir le mandat VZE, que la politique américaine diverge et que les tarifs redessinent les échanges, la question est de savoir comment le Canada peut rester compétitif tout en se préparant à un avenir électrique. Cet article propose un plan robuste pour les premières années et évolutif par la suite.
L’électrification est la direction à suivre. Selon le Global EV Outlook 2024 de l’Agence internationale de l’énergie, les ventes mondiales de véhicules électriques ont déjà dépassé leurs tendances de croissance d’avant la pandémie et devraient représenter plus de 60 % des ventes mondiales d’ici 2035 dans le cadre des politiques actuelles. BloombergNEF et l’AIE estiment que le pic mondial des ventes de véhicules thermiques (ICE) a eu lieu entre 2017 et 2019, avec un déclin structurel désormais amorcé, qui devrait s’accélérer à mesure que les réseaux de recharge se développent. Ce point de bascule signifie que retarder l’action coûterait cher à inverser. Maintenir le cap sur l’électrification peut offrir des gains majeurs en certitude d’investissement, en ancrage de la chaîne d’approvisionnement et en économies de santé publique et de coûts pour les consommateurs. Le prix stratégique est d’être prêt lorsque le monde, y compris les États-Unis, se tournera résolument vers l’électrique.
Les PDG de constructeurs automobiles au Canada ont pressé Ottawa d’abroger le mandat VZE dans des lettres privées et des rencontres avec le Premier ministre, comme l’ont rapporté CBC News et Bloomberg à la mi 2025, et je comprends pourquoi. Si les États-Unis assouplissent leurs règles sur les émissions et réorientent leurs capitaux vers les camions et VUS thermiques, tandis que le Canada maintient son cap sur les VÉ, nous risquons de perdre l’intégration avec la chaîne d’approvisionnement nord-américaine et les économies d’échelle qui l’accompagnent.
Cependant, abandonner le mandat figerait des émissions plus élevées et laisserait le Canada derrière l’Europe et l’Asie, où les politiques demeurent fermes malgré le resserrement des barrières commerciales.
Ajouter le Mexique à l’équation. Le Mexique est un grand exportateur de véhicules qui profite du rapprochement des chaînes d’approvisionnement. Si l’élan américain pour les VÉ ralentit, le Mexique peut tout de même attirer des investissements dans les VÉ et les composants destinés à l’Amérique latine et au-delà. Un partenariat sur les chaînes de valeur, des matériaux jusqu’aux modules, permet de préserver les économies d’échelle nord-américaines et de positionner les deux pays pour accélérer lorsque la politique américaine évoluera.
Donnée clé : En juin 2025, le Canada a importé environ 1,08 G$ de voitures particulières en provenance du Mexique contre ~950 M$ en provenance des États-Unis. C’était le premier mois où le Mexique arrivait en tête par valeur, ce qui renforce l’argument en faveur d’un pipeline Canada–Mexique alors que la politique américaine demeure incertaine.
Deux scénarios plausibles
Séparation courte (2 à 4 ans) : les États-Unis réalignent leurs règles et incitatifs pour les VÉ, rétablissant l’échelle continentale.
Séparation longue (5 à 10 ans) : les tarifs et la divergence politique persistent, et le Canada et le Mexique portent davantage l’élan régional des VÉ.
Comme ces deux scénarios ne divergent qu’après quelques années, la phase initiale doit être la même : un plan sans regret valable dans les deux cas.
Trois premières années : plan sans regret
Maintenir le cap du mandat VZE avec flexibilité : permettre la mise en réserve et l’emprunt limité de crédits, et offrir un crédit transitoire et dégressif pour les VHR branchables lié à l’usage réel en mode électrique.
Renforcer la clarté de la demande et l’infrastructure : rétablir des incitatifs prévisibles à l’achat alignés sur l’efficacité des véhicules et la durabilité des batteries (empreinte carbone et approvisionnement responsable), et développer la recharge publique ainsi que l’adaptation pour la recharge résidentielle afin de rassurer les consommateurs.
Maintenir l’économie d’échelle continentale : établir un pipeline Canada–Mexique avant l’examen de l’ACEUM de 2026 sur les règles d’origine, les normes de recharge, la logistique et un passeport batterie commun.
Ancrer les investissements dans la chaîne d’approvisionnement : sécuriser des accords de plateforme (attributions de production, R-D partagée ou ententes d’approvisionnement) avec des constructeurs européens, chinois, japonais et coréens, et garantir des contrats à long terme pour les minéraux critiques et le recyclage.
Années 4 à 10 : actions selon le scénario À partir de la troisième année, le plan bifurque selon le scénario.
Si la politique américaine se réaligne d’ici 2028 (séparation courte) :
Éliminer progressivement le pont VHR?; mettre fin à l’emprunt de crédits d’ici 2030.
Durcir les limites de mise en réserve et donner priorité au contenu Canada–É.-U. et aux corridors de VÉ transfrontaliers.
Harmoniser la recharge, les paiements et les données?; reconnaître réciproquement les crédits pour accélérer la montée en puissance.
Si la séparation persiste pendant 5 à 10 ans (séparation longue) :
Créer un couloir de conformité Canada–Mexique avec des multiplicateurs de crédits plus élevés pour le contenu conforme.
Développer la chaîne d’approvisionnement domestique en amont des batteries (cathodes/anodes, moteurs, électronique de puissance, logiciels) et accélérer les raccordements au réseau.
Maintenir les garde-fous sur les véhicules finis tout en ouvrant sélectivement des canaux pour les composants et outillages sous règles strictes de sécurité et de traçabilité?; développer des routes d’exportation vers l’UE et l’Amérique latine.
Cohérence et stabilité des politiques
Les principes ci-dessus sous-tendent les deux scénarios plausibles et devraient guider les choix, quelle que soit l’évolution de la politique américaine. Ils mettent aussi en lumière un défi structurel : contrairement au modèle centralisé de la Chine, le processus démocratique canadien exige consultation, débat et compromis, ce qui rend la cohérence plus difficile, mais la légitimité plus forte.
Aligner les mesures nationales grâce à des consultations structurées, des études d’impact transparentes et un débat parlementaire pour renforcer l’acceptabilité sociale.
Ancrer les règles VÉ et chaînes d’approvisionnement dans des accords internationaux (p. ex. Canada–Mexique, Canada–UE, Canada–Japon). Ceux-ci offrent plus de certitude que les seules politiques domestiques, qu’un futur gouvernement pourrait renverser.
Établir des garde-fous sur les partenariats avec la Chine : transfert technologique, redevances et transparence de l’approvisionnement, afin que la coopération ne se transforme pas en dépendance.
Assurer des règles stables pour les investisseurs. L’instabilité politique décourage le financement plus que des cibles ambitieuses.
Pourquoi cet équilibre est important
Le gain potentiel : Être prêt lorsque le monde, y compris les États-Unis, se tournera résolument vers l’électrique, en obtenant la priorité pour les attributions de plateformes, les investissements fournisseurs et les corridors d’exportation.
Le mandat procure une certitude d’investissement et une flexibilité intégrée pour réduire le risque de conformité si le marché américain ralentit. En même temps, des engagements solides dans la chaîne d’approvisionnement positionnent le Canada comme un pivot de l’écosystème VÉ, prêt à croître lorsque le cycle tournera.
Des incitatifs prévisibles à l’achat, combinés à des investissements visibles dans les réseaux de recharge publics et au soutien à la recharge résidentielle, soutiennent la demande des consommateurs en leur montrant qu’il est pratique et réalisable de posséder un véhicule électrique.
Des garde-fous et un pacte Canada–Mexique préservent la résilience, équilibrant concurrence mondiale et stabilité régionale.
Le Canada n’a pas à choisir entre ambition et réalisme, ni entre intégration continentale et diversification via le Mexique. Nous pouvons maintenir le cap sur les résultats, adapter le chemin et être prêts à diriger lorsque la politique nord-américaine évoluera et que le marché se tournera résolument vers l’électrique.
Quelles mesures le Canada devrait-il prioriser maintenant??