Le gouvernement du Québec propose de revoir la norme sur les véhicules zéro émission (VZE). Si l’ajustement de la cible de 2035 à 80 % peut s’entendre comme une « soupape de sécurité » politique pour les usages d’exception, le véritable problème réside dans l’affaissement des cibles intermédiaires (notamment pour 2027 et 2030).
La fausse contrainte de l’approvisionnement : Le marché québécois est modeste à l’échelle mondiale. Réduire nos exigences n’aide pas nos concessionnaires : cela incite plutôt les constructeurs à rediriger leurs inventaires de VE vers des marchés plus contraignants, créant une rareté artificielle ici même.
L’opportunisme réglementaire : Fléchir devant les pressions envoie un signal de faiblesse et décourage les investissements nécessaires, notamment dans la formation technique chez les concessionnaires.
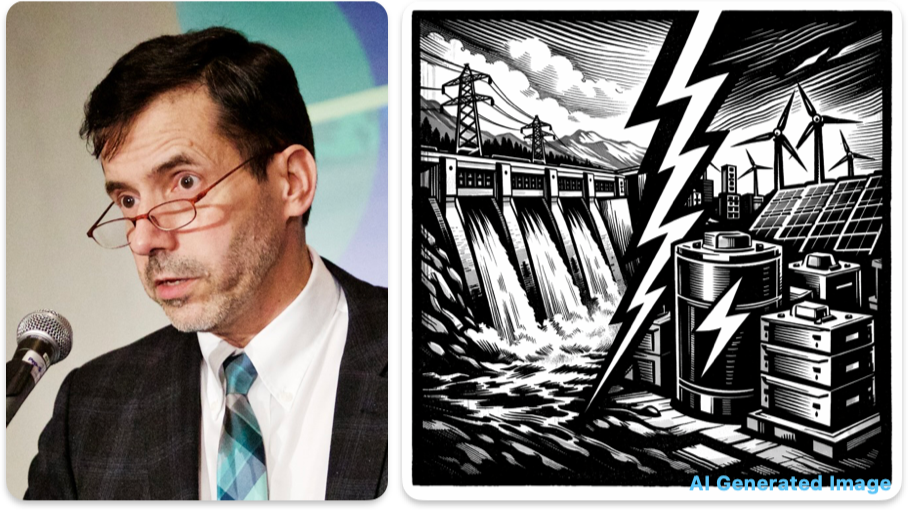
La gestion du réseau électrique : La pointe hivernale se gère très bien grâce à la recharge intelligente et au potentiel du V2G (véhicule-réseau). De plus, les cycles d’hydraulicité actuels sont temporaires et ne doivent pas freiner notre transition.
Pour préserver la souveraineté énergétique du Québec et donner de la prévisibilité aux marchés, la solution passe par le maintien de cibles intérimaires ambitieuses.
Vous pouvez consulter l’intégralité de mon mémoire ici :
La publication définitive du premier Plan de gestion intégrée des ressources énergétiques (PGIRE) 2026-2050 s’apparente davantage à un document d’orientation gouvernementale qu’à une véritable feuille de route énergétique et industrielle.
Le Québec s’est doté d’une trajectoire énergétique. Il ne s’est pas encore doté du système de pilotage permettant de décider quand accélérer, ralentir, exercer une option ou en abandonner une.
C’est là que réside la véritable faiblesse du PGIRE : en retenant une trajectoire unique jusqu’en 2050, il tente essentiellement de prévoir l’avenir plutôt que de nous préparer à plusieurs avenirs possibles.
Si le ministère choisit une direction, il ne publie pas avec suffisamment de précision la trajectoire physique et économique qui permettrait aux entreprises, aux producteurs, aux équipementiers et aux gestionnaires d’infrastructures d’aligner leurs propres investissements.
C’est particulièrement problématique pour un exercice qui porte précisément le nom de Plan de gestion intégrée (le «?G?» et le «?I?» de PGIRE) : ces deux notions supposent normalement que l’on puisse voir les interdépendances entre les vecteurs et suivre leur évolution.
En réalité, ce document ressemble surtout à un exercice de conformité réglementaire de type «?check the box?» à qui il manque encore un cadre de gestion opérationnel.
Ayant eu l’occasion d’analyser le rapport préliminaire du PGIRE dans le cadre des audiences de la Régie de l’énergie, il est intéressant de mesurer l’évolution des travaux.
Si le document final intègre certains gains analytiques, il subsiste des faiblesses structurelles majeures. Voici un regard constructif sur les avancées réelles, des limites et des incohérences de ce document gouvernemental piloté par le Ministère de l’Économie, de l’Innovation et de l’Énergie du Québec (MEIE).
1. Les acquis : Ce que le PGIRE final a mieux intégré après l’avis de la Régie
Le PGIRE final démontre une écoute sélective, mais réelle, de la Régie de l’énergie et de ses experts. Le passage du document préliminaire au plan final montre des gains analytiques notables :
De l’énergie à la puissance : Le plan final accorde désormais une place beaucoup plus explicite à la pointe hivernale. C’est cette contrainte de puissance, et non la consommation globale, qui dimensionne une part importante du réseau et des investissements futurs.
La valeur du stockage : L’intégration des systèmes de stockage par batteries (BESS) est désormais actée comme un outil incontournable de gestion de la puissance à court et moyen terme, conformément à l’Avis de la Régie de l’énergie.
Les interconnexions comme actifs de résilience : Elles sont désormais modélisées comme des soupapes de sécurité bidirectionnelles indispensables pour pallier les risques d’hydraulicité ou les froids extrêmes.
2. Les angles morts de la gouvernance : Moins de détails que dans la version préliminaire
Si l’on compare le PGIRE final au rapport préliminaire analysé par la Régie, le recul est manifeste.
Plutôt que de corriger les faiblesses d’analyse soulevées lors des audiences publiques, le document final opère un net retrait sur des éléments pourtant essentiels au pilotage de notre transition :
Le recul de la transparence et des données : Alors que la version préliminaire esquissait différentes trajectoires, le plan final s’enferme dans une trajectoire unique, sans même en fournir un tableau de synthèse consolidé. Pire encore, des données et hypothèses cruciales du scénario de référence ont été retirées des annexes par le MEIE. Cette opacité privera les entreprises et les planificateurs régionaux de la visibilité indispensable pour coordonner leurs propres investissements.
L’absence de scénarios de stress : Le plan continue de se baser sur des trajectoires moyennes lissées. Il refuse de tester la robustesse du réseau sous stress de manière transparente (par exemple, une faible hydraulicité prolongée combinée à un froid extrême de plusieurs jours et des pannes d’importation). Modéliser la transition sans scénario de stress limite grandement la résilience réelle du système.
Le refus de la reddition de comptes annuelle : Le gouvernement a expressément écarté la Recommandation R2 de la Régie de l’énergie, qui demandait la publication d’un tableau de bord annuel PGIRE (suivi des coûts réels, de la résilience et des impacts tarifaires réels), préférant s’en tenir à un exercice statique révisable tous les trois ou six ans.
3. Le découplage physique entre production et transport : Un maillon manquant
Un plan de gestion intégré doit arrimer la géographie de la production avec celle de la livraison.
Or, le PGIRE final continue de modéliser des ajouts de production massifs (éolien, solaire) de manière isolée, omettant la Recommandation R12 de la Régie de l’énergie, qui exigeait l’arrimage géographique explicite entre les zones de production et les capacités de transport réseau pour éviter les congestions.
Ce maintien d’un découplage réglementaire est d’autant plus préoccupant qu’il limite la portée opérationnelle du plan.
Ici aussi, le ministère semble s’en remettre principalement à la capacité d’Hydro Québec de régler la structure physique après coup, lui laissant le soin de résoudre ultérieurement l’arrimage physique entre les trajectoires énergétiques du PGIRE et les contraintes du réseau.
Sans cet arrimage, nous risquons de produire des électrons propres que le réseau physique sera incapable d’acheminer là où se trouve la charge industrielle.
4. Le défi de la «?mi-transition?» : Gérer la coexistence physique et la substituabilité
La transition énergétique n’est pas un interrupteur que l’on bascule, mais une succession de phases intermédiaires complexes — la mi-transition — où doivent cohabiter des infrastructures fossiles et des réseaux électriques en construction.
La sécurité énergétique globale doit intégrer l’ensemble des vecteurs : l’électricité, bien sûr, mais aussi les carburants fossiles qui conservent leurs propres profils de risques logistiques et géopolitiques.
Il ne s’agit pas ici d’ériger la conservation des infrastructures existantes en principe général, mais d’éviter de détruire prématurément des options de sécurité d’approvisionnement avant que les solutions de remplacement ne soient réellement disponibles sur le terrain.
À l’inverse, avoir des usages, équipements et chaînes logistiques non substituables à court terme élargit le périmètre des risques au lieu de le réduire.
Sans cette substituabilité réelle, la diversification est une illusion : un choc de prix sur le pétrole ou le gaz déclenchera une crise majeure pour ses clients captifs, peu importe la robustesse de notre réseau électrique parallèle.
Une crise sectorielle non substituable demeure une crise économique systémique pour l’ensemble du Québec.
5. Remplacer l’adaptabilité passive par un cadre de gestion active sous incertitude
Le PGIRE se présente comme un document agile grâce à ses cycles de révision de trois à six ans.
Or, à l’échelle de la transition industrielle, ces délais administratifs s’avèrent longs, passifs et dénués de jalons intermédiaires quantifiés, à rebours de ce que préconisait la Recommandation R1 de la Régie de l’énergie (qui réclamait des indicateurs d’étape mesurables à court terme).
Le défaut profond du PGIRE n’est pas simplement l’absence de scénarios de stress. C’est surtout l’absence d’une véritable logique d’optionalité reliant l’évolution du contexte aux décisions futures.
Il ne s’agit pas de fixer aujourd’hui des seuils précis pour 2035 ou 2050. Nous ne savons pas à quel prix seront les batteries, à quelle vitesse évolueront les différentes technologies, ni quels risques climatiques ou géopolitiques se matérialiseront.
La planification ne consiste donc pas à prédéterminer les décisions futures, mais à préserver et préparer des options afin de pouvoir les exercer au bon moment.
Un véritable plan de gestion doit fournir un cadre décisionnel dynamique, capable de séquencer les choix d’infrastructures autour de trois piliers d’affaires :
Le pilier physique (L’approche à faible regret) : Développer les infrastructures et les ressources qui présentent un faible niveau de regret stratégique : renforcer les réseaux et les interconnexions qui ouvrent des options futures?; accélérer l’efficacité énergétique et la flexibilité?; et privilégier des ressources modulaires, comme l’éolien, le solaire et les batteries, dont le déploiement peut être ajusté plus rapidement à l’évolution des besoins.
Le pilier technologique (La gestion d’options réelles) : Identifier les évolutions susceptibles de modifier profondément la trajectoire et se préparer dès maintenant à agir rapidement si elles surviennent, en posant régulièrement des questions nécessaires, comme celles-ci :
Si le coût des batteries chute suffisamment, sommes-nous prêts à accélérer leur déploiement??
Si les contraintes de transport deviennent plus sévères que prévu, avons-nous préparé les projets et les options nécessaires??
Si l’hydraulicité se détériore durablement, quelles marges de sécurité pouvons-nous mobiliser??
Si une technologie promise tarde à devenir commercialement viable, sommes-nous prêts à réorienter rapidement les investissements??
Le pilier de la gestion des énergies fossiles déclinantes (Le déclin maîtrisé) : Planifier le déclin des infrastructures fossiles tout en préservant les capacités nécessaires à la sécurité d’approvisionnement jusqu’à ce que des solutions de remplacement réellement opérationnelles soient disponibles.
6. L’équation tarifaire : Démonter le mythe par une analyse rigoureuse
Le document affirme que le Québec préservera ses bas tarifs.
Or, la hausse du coût marginal des nouveaux approvisionnements pose trois questions distinctes que le PGIRE traite insuffisamment :
Combien coûtera réellement la prochaine tranche d’électricité?;
Comment ces coûts seront-ils répartis entre les catégories tarifaires?;
Comment protéger les ménages vulnérables sans affaiblir le signal de prix nécessaire à l’efficacité énergétique??
En confondant ces trois enjeux, le PGIRE se réfugie derrière une posture défensive.
Ériger le «?meilleur coût?» en orientation maîtresse (Orientation 5) trahit un manque de vision : le coût est une contrainte de gestion?; la véritable ambition stratégique doit être la création de richesse dans la société.
Dans ce débat, la compétitivité des PME mérite une attention particulière. Leur demander de s’électrifier tout en leur faisant supporter une part croissante des coûts du système serait économiquement incohérent.
7. Réalisme de marché vs Paris spéculatifs
Sur la gestion technologique, le PGIRE s’expose à des risques industriels en transformant ce qui devrait être une veille technologique prudente en cibles réglementaires rigides.
Le transport lourd : Le plan insiste sur la filière hydrogène pour le camionnage lourd, citant l’existence de 15?000 camions à hydrogène à l’échelle mondiale, selon l’Agence internationale de l’énergie (AIE). Pourtant, le marché mondial a déjà largement basculé vers l’électrification directe. Selon l’AIE, les ventes mondiales de camions électriques ont dépassé les 400?000 unités pour la première fois en 2025, doublant par rapport à l’année précédente, et l’essor des stations d’échange rapide de batteries (battery swapping) contribue à résoudre la contrainte du temps de recharge.
Le captage et le stockage de carbone (CSC) : Le plan s’en remet à des solutions de CSC pour compenser les émissions industrielles résiduelles. Or, outre son coût financier et énergétique colossal, cette technologie se heurte au Québec à un défi géologique majeur. Contrairement à l’Ouest canadien, les structures géologiques de la vallée du Saint-Laurent sont mal caractérisées pour le stockage permanent du CO2 et suscitent une vive opposition sociale. En faire un pilier de planification d’ici 2035 est un pari industriel à haut risque.
L’hydrogène géologique : Fixer des cibles précises pour 2035 sur cette technologie hautement spéculative est prématuré. Bien que l’hydrogène naturel (natif) présente un potentiel théorique d’intérêt, sa viabilité commerciale globale et le comportement de ses flux d’extraction à grande échelle demeurent hautement incertains. De plus, l’hydrogène natif pouvant être associé au méthane, le plan crée une zone grise réglementaire qui risque de servir de moyen de contourner l’interdiction de l’exploration des hydrocarbures votée au Québec.
8. La gouvernance : Le chaînon manquant de l’exécution et le rôle du ministère
Enfin, la mise en œuvre de ce plan se heurte à un enjeu de gouvernance administrative.
Le PGIRE aurait pu être l’outil par lequel le MEIE affirmait pleinement son rôle de planificateur et d’arbitre de l’ensemble des vecteurs énergétiques. En pratique, le document donne plutôt l’impression que la planification électrique demeure largement structurée autour du plan 2035 d’Hydro-Québec.
Ce retrait technique du ministère explique en partie l’absence de visibilité méthodologique dénoncée plus haut. Au-delà des données absentes, cette opacité méthodologique soulève une question plus fondamentale :
Le MEIE dispose-t-il aujourd’hui de la capacité autonome de modélisation, de contre-expertise et d’arbitrage nécessaire pour exercer pleinement son rôle de planificateur énergétique??
Le PGIRE explore l’avenir, mais ne construit pas encore suffisamment la capacité d’agir sous incertitude.
Conclusion
La transition énergétique n’est pas un problème d’optimisation mathématique à résoudre à l’horizon 2050, mais un problème de pilotage en situation d’incertitude.
Pour que le PGIRE devienne le moteur de prospérité industrielle qu’il devrait être, le Québec doit retrouver l’ambition de ses bâtisseurs des années 1960.
Comme l’écrivait Hydro-Québec en 1964 dans son manifeste sur le projet Manicouagan :
«?Il y a des pays pour les enfants, d’autres pour les hommes, quelques-uns pour les géants.?»
Ayons à nouveau l’audace de voir grand, mais donnons-nous les outils de gestion rigoureux pour y parvenir.
In the first article, I looked at diversity in Hydro Québec’s senior management: the place of women, visible diversity in the organization charts, and the limits of an analysis based on public documents.
This second text focuses on another strong signal: the growth in the number of leaders visible in senior management organization charts.
Since 2005, the number of people at director level and above has increased from about 120–130 to just over 200. That is an increase of more than 50%, essentially since 2015.
The chart clearly shows the contrast between the two dynamics. The total workforce declined slightly until the mid-2010s, then rose sharply. The number of people visible in senior management remains fairly stable until the Martel period, then increases markedly from the late 2010s onward.
Taken alone, the number of people in senior management can easily lead to an overly quick conclusion: Hydro-Québec has simply become heavier.
That is partly possible. But the story is more interesting than that.
The increase in the number of leaders is neither regular over time nor evenly distributed across functions. It also accompanies a deeper change in organizational logic.
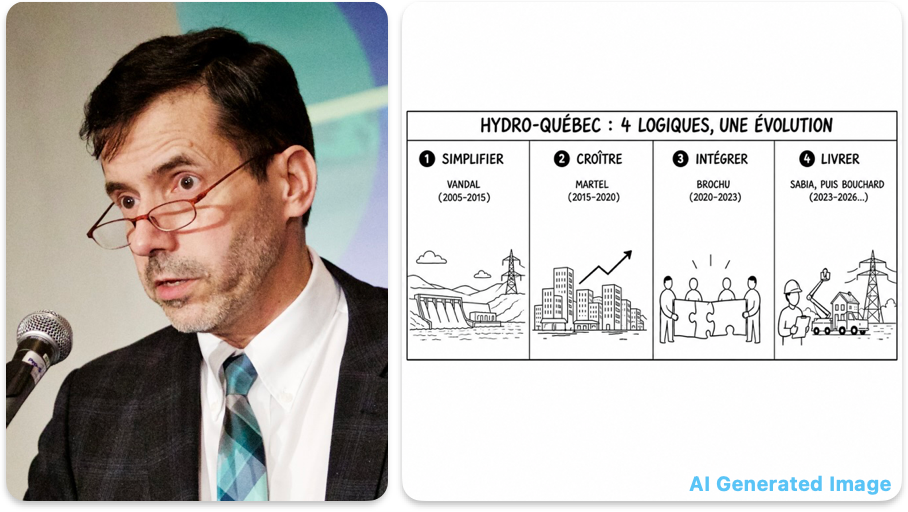
The simplest reading is probably this: with Thierry Vandal, Hydro-Québec mainly seeks to simplify; with Éric Martel , it seeks to grow; with Sophie Brochu , it seeks to integrate; under Michael Sabia and Claudine Bouchard, ASC, it mainly seeks to deliver.
How I Counted
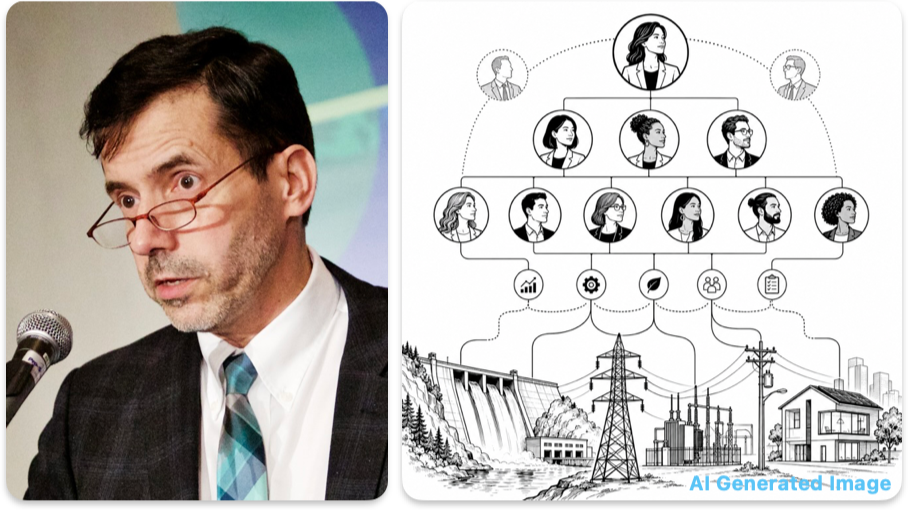
I reviewed 27 Hydro-Québec senior management organization charts from 2005, at the start of Thierry Vandal’s presidency, through 2026.
Senior management organization charts for 2005 and 2026.
In practice, these organization charts correspond to Hydro-Québec’s management level 3 and above: directors, senior directors, vice-presidents, and the other positions visible in the charts.
This choice has an important limitation: it does not capture Hydro-Québec’s entire management structure. Below these levels, there are also level 4 and 5 managers and, in some cases, team leaders, coordinators and other supervisory roles. The analysis therefore does not cover all managers in the company.
It remains relevant, however, because at Hydro-Québec, major decisions are generally made at director level and above. That is where the major trade-offs, organizational priorities and the most visible positions in the power structure sit.
I excluded vacant positions. People who appeared more than once were counted only once. For interim positions, I kept the persons, but assigned them to the highest level at which they appeared. To compare with the total workforce, I used Hydro-Québec’s annual reports.
The Transformation Phases
The phase-by-phase reading is more revealing than a simple upward curve.
The growth in the number of leaders did not really begin in 2005. It is concentrated mainly from Martel onward, after 2015, then changes under Brochu with “One Hydro,” before continuing under Sabia and now Bouchard in a context of accelerated execution.
Vandal: Simplify
Under Thierry Vandal, from 2005 until Éric Martel’s arrival, the number of people visible at director level and above remains broadly stable.
This is not a period of marked growth. Hydro-Québec seems instead to follow a logic of simplification, rationalization and cost control.
The structure is then based on functional separation. In simple terms, the major functions remain in their own columns: generation on one side, the transmission grid on another, then the distribution grid and retail customer sales in one combined group. It is a traditional, legible and fairly siloed organization, in which each major function keeps its own chain of command.
This can also be seen in some more specific choices expressed in the organization chart, such as the merger or rationalization of telecommunications functions. It can also be seen in projects such as smart meters, which reduce the recurring costs associated with manual meter reading.
In other words, this period does not really add new families of functions to the organization chart. It mainly seeks to consolidate, simplify and do better with a relatively stable structure. This logic of functional separation continues under Martel, before being largely dismantled under Brochu with “One Hydro.”
Martel: Grow
Éric Martel arrives from the private sector with clearer priorities: customer service, growth of activities and productivity.
The stated objective is ambitious: to lay the groundwork to double revenues in fifteen years.
The functional separation structure remains in place, but strategy, development and transformation functions are added around it in the organization chart.
This is also the period when certain new capabilities become more visible: a more direct public presence, Hilo demand management as a new series of functions downstream of the meter, and a more strategic approach to material procurement.
In other words, Martel does not only add positions. He mainly adds functions related to growth, customer relations, development and productivity.
Brochu: Integrate
With Sophie Brochu, the emphasis changes.
The revenue-growth narrative is abandoned. The central point becomes integration. “One Hydro” aims to reduce silos and better coordinate the company’s major functions. This is therefore the moment when the traditional functional separation between the major functions is dismantled at the top of the organization chart.
The idea is no longer primarily to sell more. It is to make better use of available electricity, strengthen energy efficiency and demand management, and make better trade-offs at the best collective cost.
In the organization charts, this logic is visible in the rise of transversal functions. Positions related to strategy, planning, development, customers, digital, governance, risk, performance, procurement and innovation have risen from about 40 before “One Hydro” to more than 60 in recent organization charts. There are therefore more functions that do not correspond to a traditional electricity business line, but that cut across several functions.
This is consistent with the spirit of “One Hydro,” but it increases the organizational distance between the components of the same business line.
Sabia, then Bouchard: Deliver
Under Michael Sabia and now Claudine Bouchard, the priority appears to be less about redrawing the organization than about setting transformative objectives and executing. The count of visible functions in the organization charts therefore suggests that the Sabia-Bouchard period consolidates the structure already made more integrated under Brochu, while orienting it more toward execution: projects, operations, maintenance, reliability, procurement and coordination of deployment.
The context is one of demand growth, connections, reliability, procurement, grid modernization and the 2035 Action Plan.
The 2035 Action Plan plays an important role here. It gives the organization a clearer target, a faster pace and much stronger execution pressure. Hydro-Québec must now connect more, build more, buy more, coordinate more and deliver within tighter timelines.
The classic functions of generation, transmission and distribution also reappear lower down in the organization chart, while the customer function remains clearly separate.
This suggests a possible limit of the “One Hydro” model. By integrating at the top, the organization must recreate lower down some of the functional distinctions it sought to overcome.
The count of visible functions in the organization charts therefore suggests that the Sabia-Bouchard period consolidates a structure already made more integrated under Brochu, while orienting it more toward execution: projects, operations, maintenance, reliability, procurement and coordination of deployment.
A Necessary Caution: Possible Title Inflation
An important nuance must nevertheless be added.
Part of the increase in the number of leaders may reflect new functions or expanded missions. But another part may also come from title inflation or from some positions moving upward in the organization chart.
In other words, an increase in the number of directors and above does not automatically mean that Hydro-Québec has added an equivalent number of real new layers of power or coordination. In some cases, it may be the same work, but with a higher hierarchical level or a more developed structure around a function that already existed.
The example of the direction responsible for “energy movements” — the transmission system operator — illustrates the point well. Initially a director-level function, level 3, it became, in 2015, a senior director-level function, level 2, with its own directors. In such a case, the number of positions visible in the organization chart increases, even if it does not necessarily represent the appearance of an entirely new mission.
This nuance does not overturn the analysis. It makes it stronger.
Yes, the organization chart is growing. Yes, new functions are appearing or taking up more space. But we should keep in mind that part of the observed growth may also come from upgraded status, finer segmentation or more formal structuring of functions that were already present.
That is another reason why the right topic is not only the raw number of leaders. The real topic is what the organization wanted to make more visible, more autonomous, more structured or more strategic.
The Right Indicator Is Not Only the Number
It would be too easy to say: more leaders, therefore more bureaucracy.
That is not necessarily wrong, but it is incomplete.
Part of the growth in senior management may be justified. Hydro-Québec is now managing a more complex system than it did twenty years ago. Demand growth has returned. Supply chains are more fragile. Acceptability issues are heavier. Industrial customers need more electricity. Projects have to move faster. Digital technology and cybersecurity are becoming critical.
In this context, adding capabilities to strategy, procurement, digital, customer functions, acceptability or governance can be a good thing.
But there is a test.
Does this structure help the organization decide faster, prioritize better, execute better and deliver projects?
Or does it multiply committees, dependencies, grey areas and mandatory check points?
That is where the number of leaders becomes interesting. Not as an automatic criticism, but as an organizational symptom.
What the Organization Charts Suggest
The organization charts do not measure performance. They do not say whether projects move faster, whether decisions are better or whether costs are better controlled.
But they do show a transformation.
With Vandal, Hydro-Québec simplifies.
With Martel, it adds growth functions.
With Brochu, it adds integration functions.
Under Sabia and Bouchard, it strengthens steering and execution functions.
That is probably the simplest and most useful reading.
The Real Issue: Execution Capacity
Hydro-Québec is entering a period in which execution will matter more than strategy.
Good orientations will not be enough. The organization will have to connect faster, build faster, procure better, standardize more, maintain reliability, manage peaks, integrate new resources, work with communities and industry, modernize networks and keep costs under control.
In this context, the senior management structure must be judged by its ability to deliver.
A more developed organization may be more competent, more robust and better equipped to manage complexity.
It can also become slower if responsibilities are poorly defined.
That is probably the real question behind the evolution of the organization charts: has Hydro-Québec added the right capabilities, in the right places, with enough clarity to deliver the energy transition?
Conclusion
The organization chart does not only show a company that is getting bigger.
It shows a company that is changing logic: it simplifies, then seeks to grow, then tries to integrate, then has to deliver.
The initial period is marked more by stability, simplification and cost control. Additions to senior management then come with a logic of growth, then with a logic of integration, before shifting toward the harder logic of execution.
This is not necessarily a bad thing. Several of the added or strengthened functions have become essential.
But the real question is not only whether there are more leaders.
The real question is whether this densification improves execution, or whether it adds organizational distance at the very moment when Hydro-Québec must accelerate.
That is probably where an important part of the success of the 2035 Action Plan will be decided.
Dans le premier article, je regardais la diversité dans la direction d’Hydro Québec : la place des femmes, la diversité visible dans les organigrammes, et les limites d’une analyse fondée sur des documents publics.
Ce deuxième texte porte sur un autre signal fort : la croissance du nombre de dirigeants visibles dans les organigrammes de direction générale.
Depuis 2005, le nombre de personnes au niveau directeur et plus est passé d’environ 120-130 à un peu plus de 200. C’est une hausse de plus de 50 %, essentiellement depuis 2015.
Le graphique montre bien le contraste entre les deux dynamiques. L’effectif total baisse légèrement jusqu’au milieu des années 2010, puis remonte fortement. Le nombre de personnes visibles dans la direction générale, lui, reste assez stable jusqu’à la période Martel, puis augmente nettement à partir de la fin des années 2010.
Pris seul, le nombre de personnes dans la direction générale peut facilement mener à une conclusion trop rapide : Hydro-Québec serait simplement devenue plus lourde.
C’est possible en partie. Mais l’histoire est plus intéressante que ça.
La hausse du nombre de dirigeants n’est ni régulière dans le temps ni répartie également entre les fonctions. Elle accompagne aussi un changement plus profond de logique organisationnelle.
La lecture la plus simple est probablement celle-ci. Avec Thierry Vandal, Hydro-Québec cherche surtout à simplifier. Avec Éric Martel, elle cherche à croître. Avec Sophie Brochu , elle cherche à intégrer. Sous Michael Sabia et Claudine Bouchard, ASC, elle cherche surtout à livrer.
Comment j’ai compté
J’ai regardé 27 organigrammes de direction générale d’Hydro-Québec de 2005 (au début de la présidence de Thierry Vandal) jusqu’à 2026.
Organigrammes de la direction générale de 2005 et de 2026.
Concrètement, ces organigrammes correspondent au niveau 3 de direction d’Hydro-Québec et aux niveaux supérieurs : directeurs et directrices, directeurs principaux et directrices principales, vice-présidents et vice-présidentes, ainsi que les autres postes visibles dans les organigrammes.
Ce choix a une limite importante : il ne capture pas toute la structure de gestion d’Hydro-Québec. Sous ces niveaux, on retrouve aussi des chefs de niveaux 4 et 5, ainsi que, dans certains cas, des chefs d’équipe, des coordonnateurs ou d’autres rôles d’encadrement. L’analyse ne porte donc pas sur l’ensemble des gestionnaires de l’entreprise.
Elle reste toutefois pertinente, parce qu’à Hydro-Québec, les décisions importantes se prennent généralement au niveau directeur et aux niveaux supérieurs. C’est là que se trouvent les grands arbitrages, les priorités organisationnelles et les postes les plus visibles dans la structure de pouvoir.
J’ai exclu les postes vacants. Les personnes qui apparaissaient plus d’une fois ont été comptées une seule fois. Pour les postes par intérim, j’ai conservé la personne, mais je l’ai assignée au niveau le plus élevé où elle apparaissait. Pour comparer avec l’effectif total, j’ai utilisé les rapports annuels d’Hydro-Québec.
Les phases de transformation
La lecture par phases est plus éclairante qu’une simple courbe ascendante.
La croissance du nombre de dirigeants ne commence pas vraiment en 2005. Elle se concentre surtout à partir de Martel, après 2015, puis se transforme sous Brochu avec « Une Hydro », avant de se prolonger sous Sabia et maintenant Bouchard dans un contexte d’exécution accélérée.
Vandal : simplifier
Sous Thierry Vandal, de 2005 jusqu’à l’arrivée d’Éric Martel, le nombre de personnes visibles au niveau directeur et plus reste globalement stable.
Ce n’est pas une période de croissance marquée. Hydro-Québec semble plutôt suivre une logique de simplification, de rationalisation et de contrôle des coûts.
La structure repose alors sur une séparation fonctionnelle. En termes simples, les grands métiers restent dans leurs propres colonnes : la production d’un côté, le réseau de transport de l’autre, puis le réseau de distribution et la vente au détail à la clientèle dans un même ensemble. C’est une organisation traditionnelle, lisible, assez cloisonnée, où chaque grand métier garde sa chaîne de commandement.
On le voit aussi dans certains choix plus précis qui s’expriment dans l’organigramme, comme la fusion ou la rationalisation des fonctions de télécommunications. On le voit encore dans des projets comme les compteurs intelligents, qui réduisent les coûts récurrents liés à la relève manuelle des compteurs.
Autrement dit, cette période n’ajoute pas vraiment de nouvelles familles de fonctions dans l’organigramme. Elle cherche surtout à regrouper, simplifier et faire mieux avec une structure relativement stable. Cette logique de séparation fonctionnelle se prolonge d’ailleurs sous Martel, avant d’être largement démantelée sous Brochu avec « Une Hydro ».
Martel : croître
Éric Martel arrive du privé avec des priorités plus nettes : le service à la clientèle, la croissance des activités et la productivité.
L’objectif affiché est ambitieux : poser les bases pour doubler les revenus en quinze ans.
La structure de séparation fonctionnelle reste en place, mais on ajoute autour d’elle dans l’organigramme des fonctions de stratégie, de développement et de transformation.
C’est aussi dans cette période qu’on voit mieux apparaître certaines capacités nouvelles : une présence publique plus directe, Hilo comme nouvelle série de fonctions en aval du compteur, et une approche plus stratégique de l’approvisionnement de matériel.
Autrement dit, Martel n’ajoute pas seulement des postes. Il ajoute surtout des fonctions de croissance, de relation client, de développement et de productivité.
Brochu : intégrer
Avec Sophie Brochu, l’accent change.
On abandonne le récit centré sur la croissance des revenus. Le point central devient l’intégration. « Une Hydro » vise à réduire les silos et à mieux coordonner les grands métiers de l’entreprise. C’est donc le moment où la séparation fonctionnelle traditionnelle entre les grands métiers est démantelée au sommet de l’organigramme.
L’idée n’est plus d’abord de vendre plus. C’est de mieux utiliser l’électricité disponible, de renforcer l’efficacité énergétique et la gestion de la demande, et de faire de meilleurs arbitrages au meilleur coût collectif.
Dans les organigrammes, cette logique se voit par la montée des fonctions transversales. Les postes liés à la stratégie, à la planification, au développement, à la clientèle, au numérique, à la gouvernance, aux risques, à la performance, à l’approvisionnement et à l’innovation passent d’environ 40 avant « Une Hydro » à plus de 60 dans les organigrammes récents. On voit donc davantage de fonctions qui ne correspondent pas à un métier électrique traditionnel, mais qui traversent plusieurs métiers.
C’est cohérent avec l’esprit d’« Une Hydro », mais cela augmente la distance organisationnelle entre les composantes d’un même métier.
Sabia, puis Bouchard : livrer
Sous Michael Sabia, puis maintenant Claudine Bouchard, la priorité semble moins être de redessiner l’organisation que fixer des objectifs transformateurs et d’exécuter. Le comptage des fonctions visibles dans les organigrammes suggère donc que la période Sabia-Bouchard consolide la structure déjà plus intégrée sous Brochu, en l’orientant davantage vers l’exécution : projets, opérations, maintenance, fiabilité, approvisionnement et coordination du déploiement.
Le contexte est celui de la croissance de la demande, des raccordements, de la fiabilité, des approvisionnements, de la modernisation du réseau et du Plan d’action 2035.
Le Plan d’action 2035 joue ici un rôle important. Il donne une cible, un rythme et une pression d’exécution beaucoup plus forts. L’organisation doit désormais raccorder plus, construire plus, acheter plus, coordonner davantage et livrer dans des délais plus serrés.
On voit aussi réapparaître plus bas dans l’organigramme les grandes fonctions classiques, production, transport et distribution, alors que la fonction de clientèle reste nettement séparée.
Cela suggère une limite possible du modèle « Une Hydro ». À force d’intégrer au sommet, on doit recréer plus bas certaines distinctions fonctionnelles que l’on voulait dépasser.
Le comptage des fonctions visibles dans les organigrammes suggère donc que la période Sabia-Bouchard consolide plutôt une structure déjà plus intégrée sous Brochu, en l’orientant davantage vers l’exécution : projets, opérations, maintenance, fiabilité, approvisionnement et coordination du déploiement.
Une prudence nécessaire : possible inflation des titres
Il faut toutefois ajouter une nuance importante.
Une partie de la hausse du nombre de dirigeants peut refléter de nouvelles fonctions ou des missions élargies. Mais une autre partie peut aussi venir d’une inflation des titres ou d’un déplacement de certains postes vers le haut de l’organigramme.
Autrement dit, une augmentation du nombre de directeurs et plus ne signifie pas automatiquement qu’Hydro-Québec s’est dotée d’autant de nouvelles couches réelles de pouvoir ou de coordination. Dans certains cas, ce peut être le même travail, mais avec un niveau hiérarchique rehaussé ou une structure plus étoffée autour d’une fonction qui existait déjà.
L’exemple de la direction des mouvements d’énergie (l’opérateur du système de transport) illustre bien ce point. Initialement une direction (niveau 3), c’est devenu en 2015 une direction principale (niveau 2), avec ses propres directeurs. Dans un tel cas, le nombre de postes visibles dans l’organigramme augmente, même si cela ne correspond pas nécessairement à l’apparition d’une mission entièrement nouvelle.
Cette nuance ne renverse pas l’analyse. Elle la rend plus solide.
Oui, l’organigramme grandit. Oui, de nouvelles fonctions apparaissent ou prennent plus de place. Mais il faut garder en tête qu’une partie de la croissance observée peut aussi venir d’un rehaussement de statut, d’un découpage plus fin ou d’une formalisation plus poussée de fonctions déjà présentes.
C’est une autre raison pour laquelle le bon sujet n’est pas seulement le nombre brut de dirigeants. Le vrai sujet est de savoir ce que l’organisation a voulu rendre plus visible, plus autonome, plus structuré ou plus stratégique.
Le bon indicateur n’est pas seulement le nombre
Il serait trop facile de dire : plus de dirigeants, donc plus de bureaucratie.
Ce n’est pas nécessairement faux, mais c’est incomplet.
Une partie de la croissance de la direction générale peut être justifiée. Hydro-Québec gère aujourd’hui un système plus complexe qu’il y a vingt ans. La croissance de la demande est de retour. Les chaînes d’approvisionnement sont plus fragiles. Les enjeux d’acceptabilité sont plus lourds. Les clients industriels demandent plus d’électricité. Les projets doivent se faire plus vite. Le numérique et la cybersécurité deviennent critiques.
Dans ce contexte, ajouter des capacités en stratégie, approvisionnement, numérique, clientèle, acceptabilité ou gouvernance peut être une bonne chose.
Mais il y a un test.
Est-ce que cette structure aide à décider plus vite, mieux prioriser, mieux exécuter et livrer les projets?
Ou est-ce qu’elle multiplie les comités, les dépendances, les zones grises et les passages obligés?
C’est là que le nombre de dirigeants devient intéressant. Pas comme critique automatique, mais comme symptôme organisationnel.
Ce que les organigrammes suggèrent
Les organigrammes ne permettent pas de mesurer la performance. Ils ne disent pas si les projets avancent plus vite, si les décisions sont meilleures ou si les coûts sont mieux contrôlés.
Mais ils montrent une transformation.
Avec Vandal, Hydro-Québec simplifie.
Avec Martel, elle ajoute des fonctions de croissance.
Avec Brochu, elle ajoute des fonctions d’intégration.
Sous Sabia et Bouchard, elle renforce des fonctions de pilotage et d’exécution.
C’est probablement la lecture la plus simple et la plus utile.
Le vrai enjeu : capacité d’exécution
Hydro-Québec entre dans une période où l’exécution comptera plus que la stratégie.
Il ne suffira pas d’avoir de bonnes orientations. Il faudra raccorder plus vite, construire plus vite, acheter mieux, standardiser davantage, maintenir la fiabilité, gérer les pointes, intégrer de nouvelles ressources, travailler avec les communautés et l’industrie, moderniser les réseaux et garder le contrôle des coûts.
Dans ce contexte, la structure de direction doit être jugée sur sa capacité à livrer.
Une organisation plus étoffée peut être plus compétente, plus robuste et mieux équipée pour gérer la complexité.
Elle peut aussi devenir plus lente si les responsabilités sont mal définies.
C’est probablement la vraie question derrière l’évolution des organigrammes : Hydro-Québec a-t-elle ajouté les bonnes capacités, aux bons endroits, avec assez de clarté pour livrer la transition énergétique?
Conclusion
L’organigramme ne montre pas seulement une entreprise qui grossit.
Il montre une entreprise qui change de logique : elle simplifie, puis cherche à croître, puis tente d’intégrer, puis doit livrer.
La période initiale est plutôt marquée par la stabilité, la simplification et le contrôle des coûts. Les ajouts à la direction générale viennent ensuite avec une logique de croissance, puis avec une logique d’intégration, avant de se déplacer vers une logique plus dure d’exécution.
Ce n’est pas forcément une mauvaise chose. Plusieurs des fonctions ajoutées ou renforcées sont devenues essentielles.
Mais la vraie question n’est pas seulement de savoir s’il y a plus de dirigeants.
La vraie question est de savoir si cette densification améliore l’exécution, ou si elle ajoute de la distance organisationnelle au moment même où Hydro-Québec doit accélérer.
C’est probablement là que se jouera une partie importante de la réussite du Plan d’action 2035.
All these dimensions are connected. When the number of visible leaders increases, it is not only a question of size or titles. It also says something about how Hydro-Québec coordinates, segments, regroups and tries to hold together its major industrial functions under the logic of “One Hydro.”
Senior management organization charts do not say everything. But they do say something. They show what the organization chooses to make visible: its hierarchical levels, functions, priorities, silos, groupings and, sometimes, blind spots.
A simple question, a more complicated answer
My starting question was simple: has Hydro-Québec’s senior management become more female over the past twenty years?
The short answer is yes.
But the fuller answer is more interesting. Senior management has clearly become more female. The total workforce, not really. That contrast is worth examining.
How I counted
I reviewed 27 Hydro-Québec senior management organization charts from 2005, at the start of Thierry Vandal’s presidency, through 2026.
Senior management organization charts for 2005 and 2026.
In practice, these organization charts correspond to Hydro-Québec’s management level 3 and above: directors, senior directors, vice-presidents, and the other positions visible in the charts.
This choice has an important limitation: it does not capture Hydro-Québec’s entire management structure. Below these levels, there are also level 4 and 5 managers and, in some cases, team leaders, coordinators and other supervisory roles. The analysis therefore does not cover all managers in the company.
It remains relevant, however, because at Hydro-Québec, major decisions are generally made at director level and above. That is where the major trade-offs, organizational priorities and the most visible positions in the power structure sit.
I excluded vacant positions. People who appeared more than once were counted only once. For interim positions, I kept the persons, but assigned them to the highest level at which they appeared. To compare with the total workforce, I used Hydro-Québec’s annual reports.
For gender, I first relied on the French titles used in the organization charts – “directeur” vs. “directrice”, “vice-président” vs. “vice-présidente”, etc. When the title did not make it clear, the first name served as an additional indicator. This is not an HR register. But because the organization charts are in French, the titles provide a fairly solid basis for tracking the trend.
A senior management group that is clearly more female
In 2005, women represented about 14% of the people visible at director level and above.
By 2015, the figure was around 25%.
In recent organization charts, women account for almost 40% of the people in senior management.
That is a significant increase.
It also deserves to be put into perspective. Hydro-Québec is an electricity, engineering, grid operations, maintenance and major construction organization. These are not exactly sectors that have historically been highly feminized.
With an expanded senior management group that has been roughly 35% to 40% female in recent years, Hydro-Québec appears to perform better than several Canadian benchmarks in the presence of women in senior management.
The comparison must remain cautious. The organization charts studied here measure expanded senior management, meaning director level and above. Available Canadian statistics do not always measure exactly the same thing. But the order of magnitude is telling: Hydro-Québec is not lagging in the feminization of its visible senior management. Quite the opposite.
The most interesting point, however, is that this progress does not simply reflect the evolution of the overall workforce.
Evolution of four diversity indicators at Hydro-Québec: the proportion of women in expanded senior management (blue), the proportion of women in the total workforce (beige), an index of “other” family names in the senior management organization charts (purple), and the official proportion of other underrepresented groups in the total workforce (green). Senior management data come from the organization charts; total workforce data come from the annual reports.
The chart captures the contrast well.
The blue line shows the increase in the proportion of women in expanded senior management. It starts from a very low level in 2005, rises gradually, then accelerates, especially after the late 2010s.
The beige line shows the proportion of women in the total workforce. It is much more stable and slightly down over the period as a whole.
The green line shows the official data on other underrepresented groups in the total workforce. It rises clearly from the beginning of the available series.
The purple line, finally, gives an imperfect but useful indicator of the apparent diversification of family names in the senior management organization charts, with the percentage of names other than traditional French-Canadian names, for example Nguyen rather than Tremblay. It also rises, but more gradually.
The chart’s main message is clear: the transformation is real, but it does not have the same shape or the same pace, depending on whether we look at senior management, the total workforce, self-reported data or the more fragile index based on names visible in the organization charts.
A total workforce that has not become more female
According to Hydro-Québec’s annual reports, women represented 29.8% of the total workforce in 2005.
The figure reached 31.3% in 2007.
In 2025, it was 27.7%.
In other words, Hydro-Québec’s total workforce is slightly less female than it was twenty years ago.
Senior management, by contrast, has become more female.
That gap matters. It suggests that representation efforts at senior management levels have had a real effect, even though the company’s core occupations remain strongly male. The evolution of leadership therefore does not mechanically follow the overall employee pool.
It is both a positive signal and a limit.
A positive signal, because the progress at the top is real.
A limit, because a company does not transform only through its senior management organization chart. It also transforms through its occupations, internal career paths, promotions, technical positions, work sites, control centres, maintenance teams and engineering functions.
Uneven feminization across functions
It is also necessary to look at where women are located in the organization.
Feminization appears stronger in certain functions: finance, governance, corporate affairs, communications, sustainable development, customer experience, community relations and some planning or development functions.
It is less visible in the functions that carry much of the industrial execution: operations, maintenance, construction, engineering, transmission, generation and heavy asset management.
But shortcuts should be avoided. One might instinctively associate HR and organizational development with a stronger female presence. Yet in the 2026 organization chart, only one of the eight leaders in that function is a woman. That is counterintuitive, but important: the label attached to a function is not enough to predict its composition.
There are, of course, women in technical and operational functions. There are more than before, and that is, in fact, what sparked my curiosity and led to these articles. Some now hold important positions in these areas.
But the major industrial blocks remain more male.
That is probably where the real issue lies.
Another form of diversification
It is also important to distinguish gender diversity from ethnocultural and social diversity.
Hydro-Québec’s official data show significant progress for other underrepresented groups in the total workforce: Indigenous people, visible minorities, ethnic minorities and people with disabilities.
According to the annual reports, this proportion rose from 6.6% in 2013, the first year available in public reports, to 14.2% in 2025. It has, therefore, more than doubled in twelve years. This increase is clearly visible in the green line of the chart: it is steady and robust.
Family names in the senior management organization charts also provide a signal, though of a different kind. By “other names”, I obviously do not mean that a name can identify a person’s origin, identity or belonging. That would be inaccurate and reductive. I use a narrower definition: names that do not appear to belong to the traditionally dominant French-Québec or francophone European pool in large Québec organizations. In other words, names that stand apart from the very common set of names such as Tremblay, Gagnon, Roy, Côté and so on. Conversely, names such as Nguyen, Singh, Chen, Ahmed, Patel, Kowalski or Hernandez are classified in the “other names” category used here. These are only illustrative examples used to build a descriptive index, not an attempt to identify the actual origin of individuals. The index only serves to capture, imperfectly, whether the senior management organization chart is diversifying over time.
According to this index, the proportion of “other names” in the organization charts has risen from about 4% to 5% in the late 2000s and mid-2010s to about 9% to 10% in recent versions.
The trend is therefore visible, but it must be read cautiously: the senior management organization chart appears less homogeneous than it was fifteen or twenty years ago, without allowing us to treat it as a precise measure of ethnocultural diversity.
Hydro-Québec as a pool of leaders for Québec
There is also a broader effect to consider.
Hydro-Québec is not only a large company. It is also a school of industrial, technical and institutional management.
People who hold senior management positions there do not all remain at Hydro-Québec until retirement. Some leave to lead other organizations, private companies, Crown corporations, professional services firms, technology companies or industrial projects.
If Hydro-Québec diversifies its senior management, it can therefore indirectly contribute to diversifying Québec’s pool of leaders.
That is an important point.
A large public organization does not only transform its own internal culture. It also trains managers, executives, experts and women leaders who later circulate through the economy.
Hydro-Québec already played this role in the 1960s and 1970s. It did not only build dams and transmission lines. It also helped train a generation of engineers, managers, financiers and professionals who later left a significant mark on Québec’s economy.
In that sense, the feminization and diversification of Hydro-Québec’s senior management can also have an effect that goes beyond Hydro-Québec itself. Gradually, they can help change the profile of leadership across Québec’s energy, industrial and institutional ecosystem.
What this really says
The conclusion is fairly clear.
Hydro-Québec’s senior management has become more female, but its overall workforce has not.
It also appears to compare relatively well with several Canadian benchmarks on the presence of women in senior management, especially considering that it operates in the electric infrastructure sector.
But this feminization remains uneven. It appears stronger in some functions and less present in several technical and operational decision centres.
The organization also appears to have diversified in other ways. Official data shows a marked increase in underrepresented groups in the total workforce. The organization charts, for their part, suggest that senior management names are less homogeneous than at the beginning of the period studied.
The next test will, therefore, not be only to reach a better overall percentage of women in senior management.
It will be to see whether this diversity, in gender as well as apparent origin, is also present in the decision centres that will actually drive the energy transition: grid, operations, construction, planning, projects, maintenance and asset management.
That is where a large part of Hydro-Québec’s future will be decided.
And perhaps also part of the future diversification of Québec’s economic leadership.
In the next article, I will look at the other major transformation visible in the organization charts: the increase in the number of leaders and the way it accompanies the new organizational logic. In other words, how Hydro-Québec moved from a more legible structure built around its major industrial functions to a denser, more transversal organization, structured more around the logic of “One Hydro.”
Toutes ces dimensions sont liées. Quand le nombre de dirigeants visibles augmente, ce n’est pas seulement une question de taille ou de titres. Cela dit aussi quelque chose de la manière dont Hydro-Québec se coordonne, se segmente, se regroupe et tente de faire tenir ensemble ses grands métiers industriels sous la logique d’« Une Hydro ».
Les organigrammes de direction générale ne disent pas tout. Mais ils disent quelque chose. Ils montrent ce que l’organisation choisit de rendre visible : ses niveaux hiérarchiques, ses fonctions, ses priorités, ses silos, ses regroupements et, parfois, ses angles morts.
Une question simple, une réponse moins simple
Ma question de départ était simple : est-ce que la direction d’Hydro-Québec s’est féminisée depuis une vingtaine d’années?
La réponse courte est oui.
Mais la réponse complète est plus intéressante. La direction s’est clairement féminisée. L’effectif total, lui, pas vraiment. C’est un contraste qui mérite d’être regardé.
Comment j’ai compté
J’ai regardé 27 organigrammes de direction générale d’Hydro-Québec de 2005 (au début de la présidence de @Thierry Vandal) jusqu’à 2026.
Organigrammes de la direction générale de 2005 et de 2026.
Concrètement, ces organigrammes correspondent au niveau 3 de direction d’Hydro-Québec et aux niveaux supérieurs : directeurs et directrices, directeurs principaux et directrices principales, vice-présidents et vice-présidentes, ainsi que les autres postes visibles dans les organigrammes.
Ce choix a une limite importante : il ne capture pas toute la structure de gestion d’Hydro-Québec. Sous ces niveaux, on retrouve aussi des chefs de niveaux 4 et 5, ainsi que, dans certains cas, des chefs d’équipe, des coordonnateurs ou d’autres rôles d’encadrement. L’analyse ne porte donc pas sur l’ensemble des gestionnaires de l’entreprise.
Elle reste toutefois pertinente, parce qu’à Hydro-Québec, les décisions importantes se prennent généralement au niveau directeur et aux niveaux supérieurs. C’est là que se trouvent les grands arbitrages, les priorités organisationnelles et les postes les plus visibles dans la structure de pouvoir.
J’ai exclu les postes vacants. Les personnes qui apparaissaient plus d’une fois ont été comptées une seule fois. Pour les postes par intérim, j’ai conservé la personne, mais je l’ai assignée au niveau le plus élevé où elle apparaissait. Pour comparer avec l’effectif total, j’ai utilisé les rapports annuels d’Hydro-Québec.
Pour le genre, je me suis d’abord basé sur les titres français utilisés dans les organigrammes. Quand le titre ne permettait pas de trancher clairement, le prénom a servi d’indice complémentaire. Ce n’est pas un registre RH. Mais comme les organigrammes sont en français, les titres donnent une base assez solide pour suivre la tendance.
Une direction nettement plus féminisée
En 2005, les femmes représentaient environ 14 % des personnes visibles au niveau directeur et plus.
En 2015, on est autour de 25 %.
Dans les organigrammes récents, on se situe à presque 40 % de femmes parmi les personnes de direction.
C’est une progression importante.
Elle mérite aussi d’être mise en perspective. Hydro-Québec est une entreprise d’électricité, d’ingénierie, d’exploitation de réseau, de maintenance et de grands chantiers. Ce ne sont pas exactement des secteurs historiquement très féminisés.
Avec une direction élargie qui se situe grosso modo entre 35 % et 40 % de femmes dans les années récentes, Hydro-Québec semble faire mieux que plusieurs repères canadiens sur la présence des femmes en haute direction.
La comparaison doit rester prudente. Les organigrammes étudiés mesurent la direction élargie, soit directeur et plus. Les statistiques canadiennes disponibles ne mesurent pas toujours exactement la même chose. Mais l’ordre de grandeur est parlant : Hydro-Québec n’est pas à la traîne sur la féminisation de sa direction visible. Au contraire.
Le point le plus intéressant, toutefois, c’est que cette progression ne reflète pas simplement l’évolution de l’effectif global.
Évolution de quatre indicateurs de diversité à Hydro-Québec : proportion de femmes dans la direction élargie, proportion de femmes dans l’effectif total, indice des noms de famille « autres » dans les organigrammes de direction, et proportion officielle des autres groupes sous-représentés dans l’effectif total. Les données de direction proviennent des organigrammes; les données d’effectif total proviennent des rapports annuels.
Le graphique résume bien le contraste.
La courbe bleue montre la progression de la proportion de femmes dans la direction élargie. Elle part d’un niveau très bas en 2005, monte graduellement, puis accélère surtout après la fin des années 2010.
La courbe beige montre la proportion de femmes dans l’effectif total. Elle est beaucoup plus stable, et légèrement à la baisse sur l’ensemble de la période.
La courbe verte montre les données officielles sur les autres groupes sous-représentés dans l’effectif total. Elle progresse nettement depuis le début de la série disponible.
La courbe mauve, enfin, donne un indice imparfait mais utile de la diversification apparente des noms de famille dans les organigrammes de direction, avec le pourcentage de noms autres que les noms canadiens-français traditionnels, par exemple Nguyen plutôt que Tremblay. Elle progresse aussi, mais de façon plus graduelle.
Le message principal du graphique est assez clair : la transformation est réelle, mais elle n’a pas la même forme ni la même vitesse selon qu’on regarde la direction, l’effectif total, les données autodéclarées ou l’indice plus fragile des noms visibles dans les organigrammes.
Un effectif total qui, lui, ne se féminise pas
Selon les rapports annuels d’Hydro-Québec, la proportion de femmes dans l’ensemble de l’effectif était de 29,8 % en 2005.
Elle atteint 31,3 % en 2007.
En 2025, elle est plutôt à 27,7 %.
Autrement dit, Hydro-Québec est légèrement moins féminine dans son effectif total qu’elle ne l’était il y a vingt ans.
La direction, elle, s’est féminisée.
Cet écart est important. Il suggère que les efforts de représentation aux niveaux de direction ont eu un effet réel, même si les métiers de base de l’entreprise demeurent fortement masculins. L’évolution du leadership ne suit donc pas mécaniquement celle du bassin global d’employés.
C’est à la fois un bon signal et une limite.
Un bon signal, parce que la progression au sommet est réelle.
Une limite, parce qu’une entreprise ne se transforme pas uniquement par son organigramme de direction. Elle se transforme aussi par ses métiers, ses parcours internes, ses promotions, ses postes techniques, ses chantiers, ses centres de conduite, ses équipes de maintenance et ses fonctions d’ingénierie.
Une féminisation inégale selon les fonctions
Il faut aussi regarder où se trouvent les femmes dans l’organisation.
La féminisation semble plus forte dans certaines fonctions : finances, gouvernance, affaires corporatives, communication, développement durable, expérience client, relations avec les communautés et certaines fonctions de planification ou de développement.
Elle est moins visible dans les fonctions qui portent directement une grande partie de l’exécution industrielle : exploitation, maintenance, construction, ingénierie, transport, production et gestion des actifs lourds.
Mais il faut éviter les raccourcis. On pourrait spontanément associer Talent et développement organisationnel à une plus forte présence féminine. Cependant, dans l’organigramme 2026, on ne compte qu’une femme sur huit dirigeants. C’est contre-intuitif, mais important : l’étiquette d’une fonction ne suffit pas à prédire sa composition.
Il y a bien sûr des femmes dans les fonctions techniques et opérationnelles. On en voit davantage qu’avant, et c’est d’ailleurs ce qui a attisé ma curiosité pour ces articles. Certaines occupent maintenant des postes importants dans ces secteurs.
Mais les grands blocs industriels restent encore plus masculins.
C’est probablement là que se situe le vrai enjeu.
Une autre forme de diversification
Il faut aussi distinguer la diversité de genre de la diversité ethnoculturelle et sociale.
Les données officielles d’Hydro-Québec montrent une progression importante des autres groupes sous-représentés dans l’effectif total, soit les Autochtones, les minorités visibles, les minorités ethniques et les personnes handicapées.
Selon les rapports annuels, cette proportion est passée de 6,6 % en 2013, la première année disponible dans les rapports publics, à 14,2 % en 2025. Elle a donc plus que doublé en douze ans. Cette progression apparaît clairement dans la courbe verte du graphique : elle est régulière et robuste.
Les noms dans les organigrammes de direction donnent aussi un signal, même s’il est d’une autre nature. Par « noms autres », je ne veux évidemment pas dire que le nom permet d’identifier l’origine, l’identité ou l’appartenance d’une personne. Ce serait inexact et réducteur. J’utilise plutôt une définition plus limitée : les noms qui ne semblent pas appartenir au bassin de noms franco-québécois ou européen francophone traditionnellement dominant dans les grandes organisations québécoises. Autrement dit, des noms qui se distinguent du répertoire très fréquent de noms comme Tremblay, Gagnon, Roy, Côté, etc. À l’inverse, des noms comme Nguyen, Singh, Chen, Ahmed, Patel, Kowalski ou Hernandez sont classés dans la catégorie des « noms autres » utilisée ici. Il s’agit uniquement d’exemples illustratifs servant à construire un indice descriptif, et non d’une tentative d’identifier l’origine réelle des personnes. Il sert seulement à capter, de façon imparfaite, si l’organigramme de direction se diversifie au fil du temps.
Selon cet indice, la proportion de noms « autres » dans les organigrammes passe d’environ 4 % à 5 % à la fin des années 2000 et au milieu des années 2010 à environ 9 % à 10 % dans les versions récentes.
La tendance est donc visible, mais elle doit être lue avec prudence : l’organigramme de direction paraît moins homogène qu’il y a quinze ou vingt ans, sans qu’on puisse en faire une mesure exacte de la diversité ethnoculturelle.
Hydro-Québec comme bassin de dirigeants pour le Québec
Il y a aussi un effet plus large à considérer.
Hydro-Québec n’est pas seulement une grande entreprise. C’est aussi une école de gestion industrielle, technique et institutionnelle.
Les personnes qui y occupent des postes de direction ne restent pas toutes à Hydro-Québec jusqu’à la retraite. Certaines quittent pour diriger d’autres organisations, des entreprises privées, des sociétés d’État, des firmes de services professionnels, des entreprises technologiques ou des projets industriels.
Si Hydro-Québec diversifie sa direction, elle peut donc contribuer indirectement à diversifier le bassin de dirigeants au Québec.
C’est un point important.
Une grande organisation publique ne transforme pas seulement sa propre culture interne. Elle forme aussi des gestionnaires, des cadres, des experts et des dirigeantes qui circulent ensuite dans l’économie.
Hydro-Québec a déjà joué ce rôle dans les années 1960 et 1970. Elle n’a pas seulement construit des barrages et des lignes. Elle a aussi contribué à former une génération d’ingénieurs, de gestionnaires, de financiers et de professionnels qui ont ensuite marqué une partie importante de l’économie québécoise.
Dans cette logique, la féminisation et la diversification de la direction d’Hydro-Québec peuvent aussi avoir un effet qui dépasse Hydro-Québec elle-même. Elles peuvent contribuer, graduellement, à changer le profil du leadership dans l’ensemble de l’écosystème énergétique, industriel et institutionnel québécois.
Ce que cela dit vraiment
La conclusion est assez claire.
Hydro-Québec s’est féminisée au sommet, mais pas dans son effectif total.
Elle semble aussi relativement bien placée par rapport à plusieurs repères canadiens sur la présence des femmes en haute direction, surtout si l’on tient compte du fait qu’elle œuvre dans une industrie d’infrastructure électrique.
Mais cette féminisation reste inégale. Elle semble plus forte dans certaines fonctions et moins présente dans plusieurs centres techniques et opérationnels.
L’organisation semble aussi s’être diversifiée autrement. Les données officielles montrent une hausse marquée des groupes sous-représentés dans l’effectif total. Les organigrammes, eux, suggèrent une direction moins homogène dans les noms qu’au début de la période étudiée.
Le prochain test ne sera donc pas seulement d’atteindre un meilleur pourcentage global de femmes dans la direction.
Ce sera de voir si cette diversité, de genre comme d’origine apparente, se retrouve aussi dans les centres de décision qui piloteront concrètement la transition énergétique : réseau, exploitation, construction, planification, projets, maintenance et gestion des actifs.
C’est là que se jouera une bonne partie de l’avenir d’Hydro-Québec.
Et peut-être aussi une partie de la diversification future du leadership économique québécois.
Dans le prochain texte, je regarderai l’autre grande transformation visible dans les organigrammes : l’augmentation du nombre de dirigeants et la manière dont elle accompagne la nouvelle logique d’organisation. Autrement dit, comment Hydro-Québec est passée d’une structure plus lisible autour de ses grands métiers industriels à une organisation plus dense, plus transversale, et davantage structurée autour de la logique d’« Une Hydro ».
L’ Institut de l’énergie Trottier a publié en octobre 2025 un rapport signé par Éloïse Edom et Normand Mousseau sur la définition intégrée de la pointe de demande d’électricité dans les régions de climat froid, avec le Québec comme cas d’analyse. (Voir https://iet.polymtl.ca/publications/rapport/definition-integree-pointe.)
Je connais Normand Mousseau et j’ai donc lu ce rapport avec intérêt. Il me semble utile sur un point très précis : il aide à mieux comprendre ce qu’est vraiment la pointe hivernale québécoise.
Le sujet peut sembler technique. Il ne l’est pas seulement.
Dans un système électrique comme celui du Québec, la pointe hivernale est une contrainte structurante. Le réseau est conçu pour elle. Les contrats d’approvisionnement, les capacités de transport et de distribution, les programmes d’effacement, les tarifs et une bonne partie des investissements sont organisés autour de quelques heures, ou de quelques jours, où le réseau est fortement sollicité.
Le mérite principal du rapport est de déplacer la discussion.
On parle souvent de la pointe comme d’un moment : l’heure la plus élevée de l’année. Le rapport propose plutôt de la regarder comme un phénomène dans le temps, avec une puissance, une durée, une énergie à déplacer et une période d’accumulation avant l’événement de pointe.
C’est, à mon avis, la contribution la plus intéressante du document.
La méthode mérite d’être expliquée simplement, parce qu’elle n’est pas évidente à la première lecture.
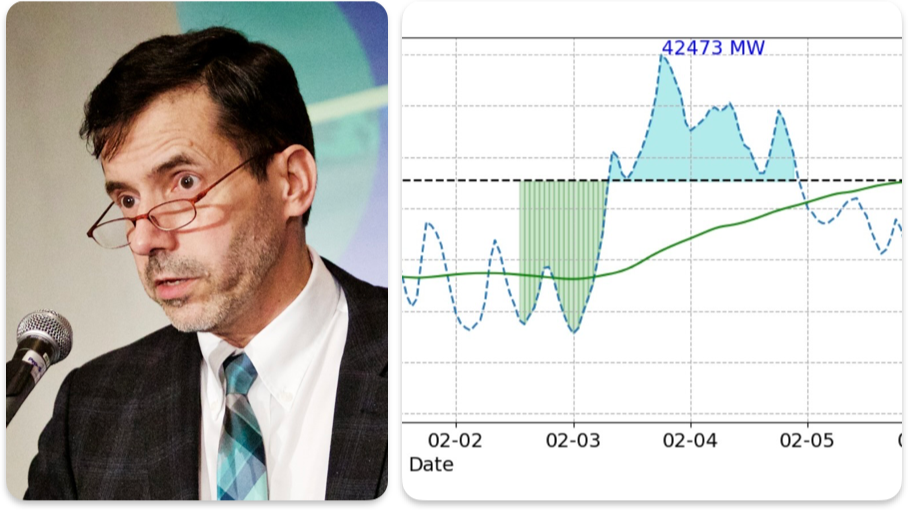
Pour une fenêtre donnée, par exemple 36 ou 72 heures autour de la pointe annuelle, la méthode demande jusqu’où on peut abaisser la puissance maximale appelée si l’énergie excédentaire au-dessus de ce nouveau plafond est accumulée avant l’événement de pointe, puis restituée pendant la pointe.
Les auteurs partent de la courbe horaire de demande d’électricité, soit 8760 heures dans l’année. Ils calculent ensuite une puissance moyenne, appelée «?puissance plafond?», pour différentes fenêtres de temps avant la pointe : 12 heures, 36 heures, 72 heures, 96 heures, etc.
Lorsque la demande dépasse ce plafond, il y a un événement de pointe.
L’énergie à déplacer correspond alors à l’aire entre la courbe réelle de demande et la puissance plafond. Ce n’est donc pas toute la consommation de la période qu’il faut déplacer. C’est seulement la partie qui dépasse le plafond.
Le rapport identifie ensuite l’événement de pointe critique, soit celui où cette aire est la plus grande. C’est cet événement qui exige le plus d’énergie à déplacer.
Enfin, les auteurs calculent combien de temps il aurait fallu pour accumuler cette énergie avant la pointe. Ils supposent que l’accumulation se fait dans les heures qui précèdent immédiatement l’événement, que le système est initialement vide, et qu’il n’y a pas de pertes.
Cette hypothèse de recharge immédiatement avant la pointe est importante. La durée d’accumulation ne dépend pas seulement de l’énergie à déplacer. Elle dépend aussi du profil de demande avant la pointe. Si le réseau est déjà fortement sollicité avant l’événement, il reste moins de marge pour recharger. Si la demande est plus basse, il y en a plus.
C’est ce qui rend l’approche intéressante. Elle ne regarde pas seulement la pointe elle-même. Elle regarde aussi ce qui se passe avant.
Le graphique ci-dessus illustre bien la logique. La courbe bleue pointillée montre la demande historique, avec un pic de 42,5 GW. La courbe verte montre la moyenne mobile sur 72 heures. La ligne pointillée noire donne le plafond correspondant, ici autour de 36,3 GW. La zone bleue au-dessus du plafond représente l’énergie à lisser pendant l’événement de pointe. La zone verte en amont représente l’énergie à accumuler avant la pointe.
C’est cette relation entre le creux avant l’événement et l’excédent pendant la pointe qui donne à l’approche son intérêt opérationnel.
Ce que montrent les ordres de grandeur
Lors des deux hivers étudiés, la pointe annuelle du réseau québécois se situait autour de 40 à 42 GW.
Dans ce contexte, une fenêtre de 36 heures permettrait déjà d’abaisser la pointe d’environ 3,5 à 3,9 GW, en déplaçant environ 13 à 15 GWh d’énergie. Cela représente près d’un dixième de la pointe annuelle.
Pour une fenêtre de 72 heures, la réduction passerait à environ 5,2 à 6,1 GW, avec environ 40 à 97 GWh à déplacer selon l’hiver analysé. On parle alors d’environ un septième de la pointe annuelle.
Ces chiffres peuvent sembler énormes. Ils le sont moins lorsqu’on les compare aux déploiements récents de batteries ailleurs.
La Californie a déjà installé plus de 20 GW de stockage par batterie, en incluant les installations résidentielles, commerciales et de réseau. Dans le marché de CAISO, les batteries raccordées au réseau représentent maintenant plusieurs dizaines de GWh. Le Texas a lui aussi dépassé les 10 GW de batteries raccordées au réseau, avec plus de 20 GWh de capacité énergétique. En Europe, la capacité totale de stockage par batterie se mesure maintenant en dizaines de GWh. En Australie, le National Electricity Market a ajouté plus de 4 GW et plus de 10 GWh de batteries de réseau en seulement douze mois.
La comparaison n’est pas parfaite. Ces réseaux ne gèrent pas la même pointe, ni le même climat, ni la même structure de demande. Mais elle donne un ordre de grandeur : quelques GW et quelques dizaines de GWh ne sont plus des chiffres extravagants dans un système électrique moderne.
Il ne faut pas non plus imaginer que toute cette capacité devrait venir de grandes batteries de réseau appartenant au distributeur ou à un producteur. Une partie peut être raccordée au réseau de transport ou de distribution. Une autre peut être derrière le compteur, chez des clients résidentiels, commerciaux ou industriels, à condition qu’elle soit agrégée, pilotable et correctement rémunérée.
Cette valeur ne se limite pas à la pointe. Des batteries décentralisées peuvent aussi contribuer à la résilience lors de pannes. À mesure que l’électricité devient, pour plusieurs ménages, la seule source d’énergie finale, réduire l’impact des interruptions de service devient beaucoup plus concret qu’avant.
L’Australie illustre bien ce point. Les batteries derrière le compteur peuvent compter. Les batteries résidentielles installées en 2025 y représentent déjà plusieurs GWh de capacité, et l’Australie-Méridionale compte maintenant plus d’un GWh de batteries résidentielles à elle seule.
Pour la pointe, la localisation des batteries compte d’ailleurs autant que leur technologie. Une capacité placée près d’une contrainte de distribution ou derrière le compteur dans des bâtiments bien choisis peut s’avérer plus précieuse qu’une capacité équivalente située ailleurs dans le réseau.
Cette logique peut aussi changer la conception des nouveaux bâtiments. Plutôt que de dimensionner chaque bâtiment comme s’il pouvait tirer sans contrainte toute la puissance qu’il souhaite du réseau, on pourrait imposer ou encourager une puissance maximale appelée, tout en maintenant le même niveau de confort. Cela pousserait vers de meilleurs choix d’enveloppe, de chauffage, de stockage thermique, de batteries, de contrôle et de gestion locale de la demande.
72 heures d’analyse ne veulent pas dire 72 heures de stockage
C’est ici qu’une distinction importante doit être faite.
Une fenêtre d’analyse de 72 heures ne veut pas dire qu’il faut un système de stockage capable de fournir sa pleine puissance pendant 72 heures.
La fenêtre de 72 heures sert à comprendre le phénomène de pointe dans son contexte météorologique et opérationnel : l’arrivée du froid, la montée de la demande, la pointe elle-même, puis le retour à un niveau plus normal.
Le système de stockage, lui, doit surtout être capable de déplacer l’énergie excédentaire au-dessus d’un certain plafond de puissance.
Il faut donc partir de l’aire au-dessus du plafond. Cette aire donne les MWh à déplacer. Les MW indiquent ensuite la puissance nécessaire pour écrêter la pointe, heure par heure. Les deux dimensions sont indispensables, mais elles ne répondent pas à la même question.
Cette distinction évite une erreur fréquente : raisonner en «?heures de batterie?» avant même d’avoir regardé l’énergie à déplacer.
Pour la pointe hivernale, la bonne question n’est pas : combien d’heures de batterie faut-il??
La bonne question est plutôt : combien de MWh faut-il rendre disponibles, à quel moment, et avec combien de MW pour respecter le plafond visé??
Le coefficient C : utile, mais à manier avec soin
Une fois qu’on a bien séparé les deux questions, les MWh à déplacer et les MW nécessaires pour écrêter la pointe, on peut utiliser le coefficient C pour traduire cela en langage de batteries.
Le coefficient C exprime simplement le rapport entre la puissance de sortie et la capacité énergétique d’un système :
C = MW/MWh
Un système avec C = 0,5 correspond à 2 MWh par MW de puissance. C’est ce qu’on appelle souvent, par raccourci, un système «?2 heures?».
Un système avec C = 0,25 correspond à 4 MWh par MW de puissance, soit un système «?4 heures?». C’est aujourd’hui une configuration très courante pour les batteries de réseau. Au Texas, les systèmes de 2 heures sont aussi très présents, tandis que les systèmes de 4 heures se développent davantage.
Un système avec C = 0,125 correspond à 8 MWh par MW. Ces configurations existent dans les analyses technico-économiques, mais elles sont nettement moins courantes dans les déploiements actuels de batteries lithium-ion. Les configurations à C = 0,25 ou C = 0,5 offrent généralement plus de polyvalence, pour un surcoût de puissance souvent justifié par les services additionnels qu’elles peuvent rendre.
Mais il faut faire attention au langage.
Dire qu’un système est «?4 heures?» ne veut pas dire qu’il doit être déchargé en quatre heures. Cela veut dire qu’il peut fournir sa pleine puissance pendant quatre heures.
Il peut être déchargé à un rythme plus lent sur une période plus longue avec une puissance réduite. Sa puissance de sortie peut aussi varier d’heure en heure selon le besoin d’écrêtement, comme la zone bleue de l’exemple : plus forte au sommet de la pointe, plus faible sur ses flancs.
Par contre, il ne peut pas fournir toute son énergie en moins de quatre heures sans une chaîne de puissance plus importante, notamment un onduleur plus puissant.
Cette distinction compte aussi pour les coûts.
À capacité énergétique donnée, un système avec plus de MW coûte généralement plus cher, parce qu’il exige une chaîne de puissance plus robuste : onduleurs, transformateurs, protections et raccordement. À puissance donnée, un système avec plus de MWh coûte généralement plus cher parce qu’il exige davantage de cellules, de modules, de conteneurs, de contrôle thermique et de systèmes de sécurité.
Autrement dit, les MW et les MWh n’ont pas la même structure de coûts.
Ce que les données suggèrent pour les batteries
À partir des données du rapport, on peut calculer le ratio puissance-énergie implicite du système de stockage requis pour écrêter la pointe critique.
Pour les fenêtres de 12 et 36 heures, les résultats sont proches des systèmes de stockage par batterie courants en réseau. Selon l’hiver étudié, l’équivalent énergétique se situe entre environ 2,6 et 4,4 MWh par MW de puissance. On est donc dans l’ordre de grandeur des systèmes dits de 4 heures.
Pour une fenêtre de 72 heures, le portrait change. L’équivalent énergétique atteint environ 7,6 MWh par MW pour l’hiver 2021-2022, mais près de 16 MWh par MW pour l’hiver 2022-2023. Pour 96 heures, on arrive à environ 8 MWh par MW dans un cas, mais plus de 20 MWh par MW dans l’autre.
Ces ratios ne veulent pas dire qu’il faut nécessairement construire des systèmes de stockage avec ces coefficients C précis. Ils indiquent plutôt la relation entre la puissance à écrêter et l’énergie à déplacer pour les épisodes analysés.
Si on utilise des batteries typiques de celles déployées en réseau, par exemple des systèmes de 2 ou 4 heures, la capacité en MW pourrait être supérieure à celle strictement requise pour l’écrêtement de cette pointe hivernale. Ce surdimensionnement en puissance n’est pas forcément inutile. Il peut servir à d’autres usages : réponse rapide, services auxiliaires, arbitrage, congestion locale, ou soutien au réseau de distribution.
Mais l’enjeu central, pour une fenêtre de 72 heures, demeure la capacité énergétique disponible. Il faut assez de MWh pour couvrir l’aire au-dessus du plafond. Ensuite seulement vient la question du nombre de MW à installer et de la valeur des MW excédentaires pour d’autres services.
Il faut donc éviter deux erreurs.
La première serait de conclure qu’un phénomène analysé sur 72 heures exige du stockage de 72 heures. Ce n’est pas ce que montrent les données.
La seconde serait de conclure que les batteries doivent être exploitées selon un cycle court et répétitif, comme si elles devaient nécessairement se charger et se décharger une ou deux fois par jour. Ce n’est pas le bon cadre ici. Pour la pointe hivernale, il faut plutôt planifier la charge et la décharge sur un horizon plus long, en fonction de l’arrivée du froid, du profil de demande avant la pointe et de l’énergie à déplacer au-dessus du plafond.
Un tel lissage peut aussi réduire les cycles de démarrage et d’arrêt des groupes turboalternateurs, ce qui limite l’usure mécanique et améliore l’exploitation du parc existant.
Le point économique : MW évités contre MWh ajoutés
Cette lecture ouvre une question économique importante : quel est le bon équilibre entre les MW de pointe évités et les MWh de stockage ajoutés??
Du côté du réseau, les coûts sont surtout liés aux MW à desservir ou à éviter : production, approvisionnements, transport, distribution, marges de capacité et programmes d’effacement. Dans le contexte d’Hydro Québec , le calcul est plus complexe, car la valeur du MW évité dépend aussi des contrats de puissance interruptible et des autres outils de gestion de la pointe.
Du côté des batteries, les coûts se partagent entre la puissance et l’énergie. À puissance donnée, ajouter des MWh coûte surtout en cellules, modules, contrôle thermique et systèmes de sécurité. Dans la structure actuelle des coûts, le total demeure généralement plus sensible aux MWh, soit l’aire bleue à couvrir, qu’aux MW de puissance maximale.
Le projet Tomago, en Australie, donne un bon ordre de grandeur : 500 MW et 2?000 MWh, soit une batterie de 4 heures, pour un coût annoncé d’environ 800 millions de dollars australiens. Comme le dollar australien et le dollar canadien sont proches de la parité, cela donne environ 1,6 million de dollars canadiens par MW, ou environ 400?000 dollars canadiens par MWh.
Appliqué mécaniquement aux besoins identifiés dans le rapport, cela donnerait environ 5 à 6 milliards de dollars pour déplacer les 13 à 15 GWh associés à la fenêtre de 36 heures. Pour la fenêtre de 72 heures, avec 40 à 97 GWh à déplacer selon l’hiver, l’ordre de grandeur serait plutôt de 16 à 39 milliards de dollars.
Ces montants sont importants. Mais ils ne doivent pas être lus comme le coût d’une solution unique entièrement composée de batteries. Ils donnent plutôt un repère pour comparer les MWh requis avec le coût des infrastructures autrement nécessaires pour desservir la pointe.
La comparaison avec Hydro-Québec est instructive. Le rapport rappelle que les coûts évités de puissance utilisés par Hydro-Québec sont de l’ordre de 164 à 249 dollars par kW-an, selon que le kW additionnel exige ou non des ajouts en transport et distribution. Appliqué aux réductions de pointe du rapport, cela représente environ 0,6 à 1,0 milliard de dollars par année pour une fenêtre de 36 heures, et environ 0,9 à 1,5 milliard de dollars par année pour une fenêtre de 72 heures.
En comparant très simplement ces valeurs annuelles avec les coûts inspirés de Tomago, on obtient une période de recouvrement brute d’environ 5 à 10 ans pour la fenêtre de 36 heures. Pour la fenêtre de 72 heures, la fourchette devient beaucoup plus large, autour de 11 à plus de 40 ans, ce qui confirme que l’optimum économique n’est pas évident et dépend fortement de l’énergie à déplacer.
On peut aussi comparer avec la centrale prévue de Churchill Falls Extension. Ce projet ajouterait environ 1?100 MW de puissance pour un coût estimé à 4,6 milliards de dollars, financement inclus, soit autour de 4,2 millions de dollars par MW. Ce n’est pas directement comparable à des batteries : l’hydroélectricité apporte une capacité appuyée par un réservoir existant et une durée de vie très longue. Mais l’ordre de grandeur montre que la flexibilité par batteries, surtout pour des fenêtres comme 36 heures, mérite d’être évaluée sérieusement face aux nouvelles ressources centralisées de pointe.
Ce n’est pas une preuve de rentabilité. Il faudrait annualiser les coûts des batteries, tenir compte de leur durée de vie, de leur dégradation, du coût de recharge, de leur localisation et de la valeur des autres services rendus. Mais la comparaison suffit à montrer que le calcul doit être fait sérieusement.
Et il faut rappeler pourquoi Tomago est intéressant : ces coûts sont possibles dans un marché où l’écosystème de développement, d’approvisionnement, de construction, de raccordement et d’exploitation des batteries est déjà performant. Le coût d’une batterie ne dépend donc pas seulement de la technologie. Il dépend aussi de la maturité de l’écosystème qui la déploie.
Il existe probablement un point optimal entre les MW de pointe évités et les MWh de stockage ajoutés. Cet optimum n’est pas fixe. Il évolue avec le coût des batteries, le coût des infrastructures de réseau évitées, les conditions des contrats de puissance interruptible, la localisation des contraintes, le profil réel de la pointe et la valeur des autres services que le stockage peut rendre.
Le Québec est dans une position particulière
Le rapport porte sur la pointe hivernale au Québec. Ce contexte est particulier : forte électrification du chauffage, parc hydroélectrique dominant, pointe annuelle concentrée autour d’épisodes de grand froid, et forte capacité de pilotage du système par Hydro-Québec.
Ce n’est pas le même problème qu’un épisode de Dunkelflaute en Europe du Nord ou dans la région de la mer Baltique, où la difficulté vient d’une faible production éolienne et solaire sur plusieurs jours. Dans ce cas, le besoin peut réellement devenir un besoin de stockage ou d’approvisionnement longue durée.
Le Québec est particulièrement privilégié. Son parc hydroélectrique lui donne déjà une forme de stockage saisonnier à très grande échelle, qui ferait l’envie de bien des réseaux. Plusieurs cherchent encore à construire, ou à remplacer, une telle capacité par des solutions beaucoup plus coûteuses.
Les batteries ne doivent donc pas être pensées comme un substitut à ce stockage saisonnier. Elles peuvent plutôt le compléter, en ajoutant de la flexibilité de courte et moyenne durée là où le système hydroélectrique, le réseau ou les programmes d’effacement atteignent leurs limites opérationnelles.
Cela ne veut pas dire que l’approche serait propre au Québec seulement. Elle pourrait devenir pertinente dans d’autres régions nordiques qui électrifient rapidement le chauffage et les véhicules, notamment l’Ontario, le nord-est des États-Unis ou certains pays nordiques.
Ces régions pourraient elles aussi vouloir éviter de construire des infrastructures capables de livrer plusieurs GW pendant quelques heures de grand froid. La différence avec une Dunkelflaute européenne est importante : on parle ici d’une pointe aiguë, souvent liée au froid, et non d’un déficit prolongé de production renouvelable sur plusieurs jours.
Cette évolution pourrait même renforcer la valeur stratégique du Québec.
Si les réseaux voisins électrifient eux aussi leur chauffage, les pointes de froid risquent de devenir plus synchronisées. Dans ce contexte, compter sur les importations pendant les heures critiques deviendra moins fiable et plus coûteux. Le Québec a donc intérêt à développer sa propre flexibilité, mais aussi à devenir un chef de file dans la façon de gérer ce type de pointe.
C’est là que le rapport de l’IET ouvre une piste utile.
Il montre que la pointe hivernale québécoise n’est pas d’abord un problème d’énergie annuelle. C’est un problème de puissance, de temporalité et de synchronisation. L’énergie au-dessus du plafond de pointe demeure faible en proportion de la consommation annuelle, mais elle est concentrée au moment où le réseau est le plus contraint.
La vraie conclusion
La conclusion applicable au Québec n’est pas : «?Les batteries règlent tous les problèmes de stockage?».
Elle est plus précise.
Pour la pointe hivernale québécoise, 36 ou 72 heures peuvent constituer de bonnes fenêtres d’analyse, sans impliquer un besoin de stockage de la même durée.
Les données suggèrent plutôt un besoin de flexibilité modulable : assez de MWh pour couvrir l’aire au-dessus du plafond, assez de MW pour écrêter la pointe, et probablement un portefeuille combinant batteries, stockage thermique, effacement et pilotage de la demande.
Cette nuance est majeure.
Elle permet de passer d’un débat abstrait sur le stockage de longue durée à une discussion beaucoup plus concrète sur le dimensionnement des moyens de flexibilité, leur coût, leur localisation, leur pilotage et leur valeur systémique.
Le prochain pas serait de traduire cette approche en scénarios de déploiement réel.
Où placer les systèmes de stockage??
Combien de MWh faut-il rendre disponibles??
Combien de MW sont vraiment nécessaires??
Quelle part peut venir du réseau, et quelle part peut venir de ressources derrière le compteur??
Pour quels services combinés??
Avec quelle valeur évitée pour le réseau??
C’est à ce niveau que la discussion devient vraiment stratégique pour Hydro-Québec et pour le Québec.
I know Normand Mousseau, so I read the report with interest. I find it useful on one very specific point: it helps clarify what Québec’s winter peak really is.
The topic may sound technical. It is not only technical.
In a power system like Québec’s, the winter peak is a structural constraint. The grid is designed around it. Supply contracts, transmission and distribution capacity, demand-response programmes, tariffs and a large share of investments are organized around a few hours, or a few days, when the system is under heavy stress.
The report’s main contribution is that it shifts the discussion.
We often talk about the peak as a moment: the highest hour of the year. The report instead proposes looking at it as a phenomenon that unfolds over time, with power, duration, energy to be shifted and a period of accumulation before the peak event.
That is, in my view, the most interesting contribution of the document.
The method deserves to be explained simply, because it is not obvious on first reading.
For a given window, for example 36 or 72 hours around the annual peak, the method asks how far maximum demand could be lowered if the excess energy above a new ceiling were accumulated before the peak event, then returned during the peak.
The authors start with the hourly electricity demand curve, the 8,760 hours of the year. They then calculate an average power level, called a “power ceiling”, for different time windows before the peak: 12 hours, 36 hours, 72 hours, 96 hours, and so on.
When actual demand exceeds that ceiling, there is a peak event.
The energy to be shifted is the area between the actual demand curve and the power ceiling. So, it is not the full consumption over the period that needs to be shifted. It is only the portion above the ceiling.
The report then identifies the critical peak event, meaning the one where that area is the largest. That is the event requiring the most energy to be shifted.
Finally, the authors calculate how long it would have taken to accumulate that energy before the peak. They assume that accumulation occurs in the hours immediately before the event, that the system is initially empty, and that there are no losses.
This assumption of charging immediately before the peak matters. The duration of accumulation does not depend only on the energy to be shifted. It also depends on the demand profile before the peak. If the grid is already heavily loaded before the event, there is less room to charge. If demand is lower, there is more room.
That is what makes the approach interesting. It does not look only at the peak itself. It also looks at what happens before it.
The chart above illustrates the logic well. The dotted blue curve shows historical demand, peaking at 42.5 GW. The green curve shows the 72-hour moving average. The black dotted line gives the corresponding ceiling, here around 36.3 GW. The blue area above the ceiling represents the energy to be smoothed during the peak event. The green area before the peak represents the energy to be accumulated ahead of it.
It is this relationship between the dip before the event and the excess during the peak that gives the approach its operational value.
What the Orders of Magnitude Show
During the two winters studied, Québec’s annual system peak was around 40 to 42 GW.
In that context, a 36-hour window would already lower the peak by about 3.5 to 3.9 GW, while shifting about 13 to 15 GWh of energy. That is close to one tenth of the annual peak.
With a 72-hour window, the reduction would increase to about 5.2 to 6.1 GW, with about 40 to 97 GWh to shift, depending on the winter studied. That is roughly one seventh of the annual peak.
Those numbers can look huge. They look less so when compared with recent battery deployments elsewhere.
California has already installed more than 20 GW of battery storage, including residential, commercial and grid-scale systems. In the CAISO market, grid-connected batteries now represent several dozen GWh. Texas has also exceeded 10 GW of grid-connected batteries, with more than 20 GWh of energy capacity. In Europe, total battery storage capacity is now measured in dozens of GWh. In Australia, the National Electricity Market added more than 4 GW and more than 10 GWh of grid-scale batteries in only twelve months.
The comparison is not perfect. These grids do not manage the same peak, the same climate, or the same demand structure. But it gives an order of magnitude: a few GW and a couple of dozen GWh are no longer extravagant figures in a modern electricity system.
Nor should we imagine that all this capacity would have to come from large grid-scale batteries owned by the distributor or by a producer. Some can be connected to the transmission or distribution network. Some can be behind the meter, at residential, commercial or industrial customer sites, provided it is aggregated, controllable and properly compensated.
This value is not limited to peak management. Distributed batteries can also contribute to resilience during outages. As electricity becomes, for many households, the only final energy source, reducing the impact of service interruptions becomes much more concrete than it used to be.
Australia illustrates this point well. Behind-the-meter batteries can matter. Residential batteries installed in 2025 already represent several GWh of capacity, and South Australia alone now has more than one GWh of residential batteries.
For peak management, the location of batteries also matters as much as their technology. Capacity placed near a distribution constraint, or behind the meter in selected buildings, can be more valuable than equivalent capacity located elsewhere on the grid.
This logic can also change how new buildings are designed. Instead of sizing each building as though it could draw as much power as it wants from the grid without constraint, we could impose or encourage a maximum demand limit while maintaining the same level of comfort. That would push toward better choices in building envelope, heating, thermal storage, batteries, controls and local demand management.
72 Hours of Analysis Does Not Mean 72 Hours of Storage
This is where an important distinction must be made.
A 72-hour analytical window does not mean that a storage system must be able to deliver its full power for 72 hours.
The 72-hour window is used to understand the peak phenomenon in its meteorological and operational context: the arrival of cold weather, the rise in demand, the peak itself and then the return to a more normal level.
The storage system, for its part, must mainly be able to shift the excess energy above a given power ceiling.
So, the starting point must be the area above the ceiling. That area gives the MWh to be shifted. The MW then indicate the power needed to shave the peak, hour by hour. Both dimensions are essential, but they do not answer the same question.
This distinction avoids a common mistake: thinking in terms of “battery hours” before looking at the energy to be shifted.
For the winter peak, the right question is not: how many hours of battery do we need?
The right question is: how many MWh need to be available, at what time, and with how many MW to respect the target ceiling?
The C-Rate: Useful, But It Has to Be Used Carefully
Once we have separated the two questions, the MWh to be shifted and the MW needed to shave the peak, we can use the C-rate to translate this into battery-system language.
The C-rate simply expresses the ratio between output power and energy capacity:
C = MW/MWh
A system with C = 0.5 corresponds to 2 MWh per MW of power. This is often called, as shorthand, a “2-hour” system.
A system with C = 0.25 corresponds to 4 MWh per MW of power, or a “4-hour” system. That is now a very common configuration for grid-scale batteries. In Texas, 2-hour systems are also very common, while 4-hour systems are becoming more widely deployed.
A system with C = 0.125 corresponds to 8 MWh per MW. These configurations exist in techno-economic analysis, but they are much less common in current lithium-ion battery deployments. Configurations at C = 0.25 or C = 0.5 generally provide more versatility, with the additional power cost often justified by the extra services they can provide.
But the language matters.
Saying that a system is “4-hour” does not mean it must be discharged in four hours. It means it can provide full power for four hours.
It can be discharged more slowly, over a longer period, at lower power. Its output can also vary hour by hour depending on the peak-shaving need, like the blue area in the example: higher at the top of the peak, lower on the shoulders.
But it cannot deliver all its energy in less than four hours without a larger power chain, including a more powerful inverter.
This distinction also matters for costs.
For a given energy capacity, a system with more MW generally costs more because it requires a stronger power chain: inverters, transformers, protection systems and interconnections. For a given power level, a system with more MWh generally costs more because it requires more cells, modules, containers, thermal management and safety systems.
In other words, MW and MWh do not have the same cost structure.
What the Data Suggest for Batteries
Using the report’s data, we can calculate the implied power-to-energy ratio of the storage system required to shave the critical peak.
For 12- and 36-hour windows, the results are close to common grid-scale battery configurations. Depending on the winter studied, the energy equivalent is about 2.6 to 4.4 MWh per MW of power. That is in the range of so-called 4-hour systems.
For a 72-hour window, the picture changes. The energy equivalent reaches about 7.6 MWh per MW for winter 2021–2022, but nearly 16 MWh per MW for winter 2022–2023. For 96 hours, it is about 8 MWh per MW in one case, but more than 20 MWh per MW in the other.
These ratios do not mean that systems must necessarily be built with these exact C-rates. They indicate the relationship between the power to be shaved and the energy to be shifted for the events analyzed.
If we use batteries typical of current grid-scale deployments, for example 2- or 4-hour systems, the MW capacity could be higher than what is strictly required for this winter peak-shaving use case. That extra power capacity is not necessarily wasted. It can serve other uses: fast response, ancillary services, arbitrage, local congestion relief, or distribution support.
But for a 72-hour window, the central issue remains available energy capacity. There must be enough MWh to cover the area above the ceiling. Only after that comes the question of how many MW to install and what value any excess MW can provide for other services.
Two mistakes should, therefore, be avoided.
The first would be to conclude that a phenomenon analyzed over 72 hours requires 72 hours of storage. That is not what the data show.
The second would be to conclude that batteries must be operated on a short, repetitive cycle, as though they necessarily had to charge and discharge once or twice a day. That is not the right frame here. For the winter peak, charge and discharge need to be planned over a longer horizon, based on the arrival of cold weather, the demand profile before the peak and the energy to be shifted above the ceiling.
This kind of smoothing can also reduce start-stop cycles for turbine-generator units, limiting mechanical wear and improving the operation of the existing fleet.
The Economic Point: Avoided MW Versus Added MWh
This reading opens an important economic question: what is the right balance between avoided peak MW and added storage MWh?
On the grid side, costs are mostly tied to the MW that must be served or avoided: generation, supply, transmission, distribution, capacity margins and demand-response programmes. In Hydro Québec‘s context, the calculation is more complex, because the value of avoided MW also depends on interruptible-power contracts and other peak-management tools.
On the battery side, costs are split between power and energy. At a given power level, adding MWh mainly means adding cells, modules, thermal management and safety systems. In the current cost structure, the total cost is generally more sensitive to MWh, meaning the blue area to cover, than to maximum MW.
The Tomago project in Australia gives a useful benchmark: 500 MW and 2,000 MWh, a 4-hour battery, at an announced cost of about 800 million Australian dollars. Since the Australian and Canadian dollars are close to parity, this gives an order of magnitude of about 1.6 million Canadian dollars per MW, or about 400,000 Canadian dollars per MWh.
Applied mechanically to the needs identified in the report, this would mean about 5 to 6 billion dollars to shift the 13 to 15 GWh associated with the 36-hour window. For the 72-hour window, with 40 to 97 GWh to shift depending on the winter, the order of magnitude would be more like 16 to 39 billion dollars.
These are large amounts. But they should not be read as the cost of a single solution made entirely of batteries. They provide a benchmark for comparing the required MWh with the cost of the infrastructure that would otherwise be needed to serve the peak.
The comparison with Hydro-Québec is instructive. The report notes that Hydro-Québec’s avoided capacity costs are in the range of $164 to $249 per kW-year, depending on whether the additional kW requires transmission and distribution additions. Applied to the peak reductions in the report, this represents about $0.6 to $1.0 billion per year for a 36-hour window, and about $0.9 to $1.5 billion per year for a 72-hour window.
A very simple comparison of these annual values with the battery-cost estimates inspired by Tomago gives a rough payback period of about 5 to 10 years for the 36-hour window. For the 72-hour window, the range becomes much wider, from roughly 11 to more than 40 years, confirming that the economic optimum is not obvious and depends heavily on the energy to be shifted.
We can also compare this with Churchill Falls Extension future hydrogeneration station. That project would add about 1,100 MW of capacity for an estimated cost of $4.6 billion, including financing, or around $4.2 million per MW. This is not directly comparable with batteries: hydropower provides capacity backed by an existing reservoir and has a very long life. Still, the order of magnitude shows that battery-based flexibility, especially for windows such as 36 hours, deserves to be assessed seriously against new centralized peak resources.
This is not proof of profitability. Battery costs would have to be annualized, and the analysis would have to account for service life, degradation, charging costs, location and the value of other services provided. But the comparison is enough to show that the calculation should be done seriously.
And it is worth remembering why Tomago is interesting: these costs are possible in a market where the ecosystem for developing, procuring, building, interconnecting and operating batteries is already effective. The cost of a battery, therefore, does not depend only on the technology. It also depends on the maturity of the ecosystem that deploys it.
There is probably an optimal point between avoided peak MW and added storage MWh. That optimum is not fixed. It changes with battery costs, avoided grid-infrastructure costs, interruptible-power contract conditions, the location of constraints, the actual shape of the peak and the value of other services that storage can provide.
Québec Is in a Particular Position
The report focuses on Québec’s winter peak. This context is specific: high electrification of heating, a dominant hydropower fleet, an annual peak concentrated around cold snaps and a strong ability by Hydro-Québec to operate the system.
This is not the same problem as a Dunkelflaute event in Northern Europe or around the Baltic Sea, where the challenge comes from low wind and solar generation over several days. In that case, the need can truly become a long-duration storage or supply problem.
Québec is especially privileged. Its hydropower fleet already provides a form of very large-scale seasonal storage that many grids would envy. Several are still trying to build, or replace, such capability with much more expensive solutions.
Batteries should therefore not be seen as a substitute for this seasonal storage. They can instead complement it by adding short- and medium-duration flexibility where the hydropower system, the grid or demand-response programmes reach their operational limits.
This does not mean the approach applies only to Québec. It could become relevant in other northern regions that are rapidly electrifying heating and vehicles, including Ontario, the U.S. Northeast and some Nordic countries.
These regions may also want to avoid building infrastructure capable of delivering several GW for only a few hours of extreme cold. The difference with a European Dunkelflaute matters: here we are talking about a sharp peak, often cold-related, not a prolonged renewable-generation shortfall lasting several days.
This evolution could even strengthen Québec’s strategic value.
If neighbouring grids also electrify their heating, cold-weather peaks are likely to become more synchronized. In that context, relying on imports during critical hours will become less reliable and more expensive. Québec therefore has an interest in developing its own flexibility, but also in becoming a leader in managing this type of peak.
This is where the IET report opens a useful path.
It shows that Québec’s winter peak is not primarily an annual-energy problem. It is a problem of power, timing and synchronization. The energy above the peak ceiling remains small relative to annual consumption, but it is concentrated at the moment when the grid is most constrained.
The Real Conclusion
The conclusion for Québec is not: “Batteries solve every storage problem.”
It is more precise than that.
For Québec’s winter peak, 36- or 72-hour windows can be useful analytical frames without implying a need for storage of the same duration.
The data point instead to a need for modular flexibility: enough MWh to cover the area above the ceiling, enough MW to shave the peak, and probably a portfolio combining batteries, thermal storage, demand response and demand control.
That nuance matters.
It moves the discussion away from an abstract debate about long-duration storage and toward a much more concrete discussion about the sizing of flexibility resources, their cost, their location, their operation and their system value.
The next step would be to translate this approach into real deployment scenarios.
Where should storage systems be located?
How many MWh need to be available?
How many MW are actually needed?
What share can come from the grid, and what share can come from behind-the-meter resources?
For which combined services?
And with what avoided value for the grid?
That is where the discussion becomes genuinely strategic for Hydro-Québec and for Québec.
For a long time, the relationship between an electric utility and the people it serves was taken for granted. The utility produced and delivered. The user received the service, paid the bill and, when needed, reported an outage.
That model has not disappeared. But it is no longer enough.
The industry is moving from a world of subscribers to a world of customers, and then to a world in which a growing share of users become partners, when their interests overlap with those of the electric utility. This shift is not just a matter of vocabulary. It changes the nature of the relationship, expectations toward utilities and, ultimately, their very role in the system.
For a long time, the electricity industry has rested on a simple model: connect, produce, deliver and maintain.
In that model, the user is first a subscriber. Passive, captive and generally satisfied, because the service meets an essential need and embodies modernity itself: light, comfort, motive power, refrigeration, and access to a more efficient daily life than the means it replaces.
Québec offers a good example with rural electrification in the 1940s and 1950s, somewhat later than in Ontario. When electricity arrives, the relationship with the utility is limited to the essentials: connection, billing and outage reporting. These interactions are rare, often friction-filled, but secondary compared with the value of the service.
The weight of that legacy is still visible in the language itself. In its latest French-language annual report, Hydro Québec still uses the term “abonnements” (meaning “subscriptions” in English) to describe the number of accounts it serves. The word is a reminder that the institution’s basic logic remains that of a universal service provided to a mass of connected users.
This challenge of relationships is not entirely new. As early as 1971, Hydro-Québec acknowledged, through its French-language advertising campaign, “We are 12,012 [employees], we need to talk to one another” (“On est 12?012, il faut se parler”) that a large technical organization does not run on infrastructure and procedures alone, but also on communication and belonging. The difference today is that this need for dialogue now extends far beyond the organization itself. It also concerns the relationship with electricity users.
2. The customer: rising expectations
Over time, electricity stops being perceived as a privilege. It becomes normal. And as soon as a service becomes normal, it becomes a comparable commodity.
The user then becomes a customer. They compare their experience not only with that of customers of another distributor in a neighbouring city or province, but also with natural gas, telecoms and digital platforms.
As dependence on electricity becomes more critical, expectations rise. That is true for households, but also for commerce and industry, where a growing share of processes and equipment is becoming electrified.
3. The partner: when the user starts to act
The arrival of distributed energy resources changes the relationship.
With solar, batteries, smart thermostats, controlled water heaters, smart charging and, eventually, more active integration of electric vehicles, the user no longer only consumes. They begin to act on the system.
In practical terms, they can modulate demand, shift consumption, store energy, contribute to peak management and increase their own resilience while helping the grid.
In Québec, this transition is no longer theoretical. During the winter of 2025–2026, there were about 115,000 Hilo customers. That remains modest relative to the total residential base, but it is no longer an anecdotal experiment.
4. The central point: the utility does not decide
It is not the electric utility that decides whether a person is a subscriber, a customer or a partner. The person decides that for themselves.
Someone who pays the bill and almost never interacts remains a subscriber. Someone who demands service quality becomes a customer. Someone who wants to understand, control, optimize and participate can become a partner, provided there is real value in it for both them and the utility.
The shift in the model therefore comes first from uses, expectations and available technologies, not from institutional language.
5. The real discomfort: partners treated as controlled assets
This is where the most interesting tension appears.
In Québec, Hydro-Québec is taking a greater interest in distributed resources. But it still often approaches them as if they were primarily an extension of the grid it controls, rather than the expression of a genuine partnership with actors who also want greater autonomy.
From the perspective of the electricity grid, that approach is understandable. But from the user’s perspective, it is not enough. A partner does not only want to be useful to the grid. They also want choice, control, information and a better understanding of their own contribution.
But even that is not enough. A real partnership cannot rest only on a subsidy or a well-intentioned program. It requires a complete value proposition for the user: a clear use case, a simple path, an affordable cost, rapid implementation and performance reliable enough to justify the effort.
It also requires an execution ecosystem. A household or a business does not become a partner by decree. There must be accessible products, competent installers, integrators, stable rules, reasonable timelines, clear access to information and an experience smooth enough for adoption to reach the desired scale.
That ecosystem is not limited to the relationship between Hydro-Québec and the user. It also runs through the local electrician, the installer, the integrator and, more broadly, the training of skilled trades. The smoothness of the journey also depends on a real industrial and professional capacity on the ground.
Otherwise, even good ideas remain modest programs rather than true levers of transformation.
6. No partnership without information
From the moment customers invest in energy assets or provide services to the system, they want to see what is happening. They want data, dashboards, interfaces and open standards.
Initiatives such as Green Button Alliance, now well established in Ontario, move in that direction. On another scale, more specialized monitoring tools, such as vadiMAP in certain Hydro-Québec contexts, also show that a dashboard can become a concrete part of the partnership, not only to inform, but also to monitor performance and support the continued availability of certain financial incentives. Without simple access to data, interoperability and a minimum of transparency, the partnership remains incomplete.
A recent example illustrates this well. Hydro-Québec temporarily interrupted its online outage information service for an update while, following strong winds, several thousand users were without electricity. There was therefore no online information available on service restoration. At the system level, several thousand customers without power may seem minor. But for each affected user, the outage is total. In that context, information is not an ancillary service. It is part of the service itself.
7. The electric vehicle is already changing the relationship
The electric vehicle makes electricity more visible, more critical and more directly compared with other service experiences. For many households, it is also the first major investment that turns a simple user into an energy manager, whether through charging behaviour or through the broader way it changes daily energy use. In that sense, it often becomes the first real gateway to partner status.
Yet some Canadian utilities operate some of the best charging networks in the country, such as Québec’s Circuit électrique or BC Hydro, while still maintaining a fragmented relationship with the user of the traditional electricity service.
That separation is a missed opportunity. Precisely because it connects mobility, charging, pricing, flexibility and, eventually, storage, the electric vehicle could become one of the main entry points into a partnership relationship with the electricity system.
8. Why Québec is revealing
Québec is a particularly interesting case: a large integrated electric utility, largely decarbonized generation, strong electrification of end uses, a historic lead in EV adoption, and a growing need for winter flexibility.
On distributed solar, Hydro-Québec took an important step in spring 2026 by announcing support of $1,000 per installed kW, covering up to 40% of eligible costs. Here again, the user is no longer simply a captive consumer. They have become a potential investor in the electricity ecosystem. But subsidies are not enough.
9. What will have to change
The shift from subscriber to partner is difficult for cultural and structural reasons. Electric utilities were designed to manage heavy infrastructure, centralized grids, uniform standards and very large volumes of accounts. They are much less naturally equipped for frequent interactions, distributed trade-offs and customers who own energy assets.
Moving from subscriber to customer requires a service culture. Moving from customer to partner requires more: a culture of co-creating value with the user, but also the ability to orchestrate an ecosystem of products, installers, integrators, data and rules.
Utilities will therefore need to connect worlds that are still too separate today: billing, outages, EV charging, dynamic pricing, behind-the-meter generation, storage and consumption data, and relationships with citizens and industries.
Conclusion
The electricity industry is not only changing technologies. It is changing its relationship with the people it serves.
For a long time, utilities had subscribers. Then they learned, often imperfectly, to speak of customers. The next stage is more demanding: they will have to learn to work with partners.
The real issue is not whether utilities want partners.
The real issue is that they already have them, but still often continue to treat them as upgraded subscribers.
Pendant longtemps, la relation entre une compagnie d’électricité et ceux qu’elle dessert allait de soi. La compagnie produisait et livrait. L’usager recevait le service, payait sa facture et, au besoin, signalait une panne.
Ce modèle n’a pas disparu. Mais il ne suffit plus.
L’industrie est en train de passer d’un monde d’abonnés à un monde de clients, puis à un monde où une partie croissante des usagers deviennent des partenaires, lorsque leurs intérêts recoupent ceux de la compagnie d’électricité. Ce déplacement n’est pas qu’une question de vocabulaire. Il change la nature de la relation, les attentes envers les compagnies d’électricité et, à terme, leur rôle même dans le système.
L’industrie électrique a longtemps reposé sur un modèle simple : raccorder, produire, livrer et entretenir.
Dans ce modèle, l’usager est d’abord un abonné. Il est passif, captif et généralement satisfait, parce que le service répond à un besoin essentiel et incarne la modernité elle-même : lumière, confort, puissance motrice, réfrigération, et accès à une vie quotidienne plus efficace que celle des moyens qu’il remplace.
Le Québec en offre un bon exemple avec l’électrification rurale des années 1940 et 1950, un peu plus tardive qu’en Ontario. Quand l’électricité arrive, la relation avec la compagnie est limitée à l’essentiel : branchement, facturation, signalement des pannes. Ce sont des interactions rares, souvent avec des frictions, mais secondaires par rapport à la valeur du service.
Le poids de cet héritage reste visible jusque dans le langage. Dans son dernier rapport annuel, Hydro Québec parle encore d’«?abonnements?» pour décrire le nombre de comptes qu’elle dessert. Le mot rappelle que la logique institutionnelle de base demeure celle d’un service universel fourni à une masse d’usagers raccordés.
Ce défi de relation n’est d’ailleurs pas entièrement nouveau. Dès 1971, Hydro-Québec reconnaissait, avec sa campagne de publicité «?On est 12?012 [employés], il faut se parler?», qu’une grande organisation technique ne fonctionne pas seulement par infrastructures et procédures, mais aussi par communication et appartenance. La différence est qu’aujourd’hui, ce besoin de dialogue déborde largement : il touche aussi la relation avec les usagers.
2. Le client : la montée des attentes
Avec le temps, l’électricité cesse d’être perçue comme un privilège. Elle devient normale. Et dès qu’un service devient normal, il devient une marchandise comparable.
L’usager devient alors un client. Il compare son expérience non seulement à celle de clients d’un autre distributeur dans une ville ou une province voisine, mais aussi au gaz naturel, aux télécoms ou aux plateformes numériques.
À mesure que la dépendance à l’électricité devient plus critique, les attentes montent. C’est vrai pour les ménages, mais aussi pour le commerce et l’industrie, dont une part croissante des procédés et des équipements s’électrifie.
3. Le partenaire : quand l’usager commence à agir
L’arrivée des ressources énergétiques distribuées change la relation.
Avec le solaire, les batteries, les thermostats intelligents, les chauffe-eau pilotés, la recharge intelligente et, à terme, une intégration plus active des véhicules électriques, l’usager ne consomme plus seulement. Il commence à agir sur le système.
Concrètement, il peut moduler sa demande, déplacer sa consommation, stocker de l’énergie, contribuer à la gestion de la pointe et accroître sa propre résilience tout en aidant le réseau.
Au Québec, cette transition n’est plus théorique. Durant l’hiver 2025-2026, on peut dire simplement qu’il y avait environ 115?000 clients Hilo. Cela reste modeste à l’échelle du parc résidentiel total, mais ce n’est plus une expérimentation anecdotique.
4. Le point central : ce n’est pas la compagnie qui décide
Ce n’est pas la compagnie d’électricité qui décide si une personne est un abonné, un client ou un partenaire. C’est la personne elle-même.
Celui qui paie sa facture et n’interagit presque jamais reste un abonné. Celui qui exige de la qualité de service devient un client. Celui qui veut comprendre, piloter, optimiser et participer peut devenir un partenaire, à condition qu’il y ait un intérêt réel pour lui comme pour la compagnie d’électricité.
Le déplacement du modèle vient donc d’abord des usages, des attentes et des technologies disponibles, non du discours institutionnel.
5. Le vrai malaise : des partenaires traités comme des actifs contrôlés
C’est ici qu’apparaît la tension la plus intéressante.
Au Québec, Hydro-Québec s’intéresse de plus en plus aux ressources décentralisées. Mais elle les aborde encore souvent comme si elles étaient d’abord une extension du réseau qu’elle pilote, et non l’expression d’un partenariat réel avec des acteurs qui veulent aussi plus d’autonomie.
Vu du réseau électrique, cette approche se comprend. Mais vu de l’usager, ce n’est pas suffisant. Le partenaire ne veut pas seulement être utile au réseau. Il veut aussi du choix, du contrôle, de l’information et une meilleure compréhension de sa propre contribution.
Mais cela ne suffit pas encore. Un partenariat réel ne repose pas seulement sur une subvention ou sur un programme bien intentionné. Il repose sur une proposition de valeur complète pour l’usager : un cas d’usage compréhensible, un parcours simple, un coût abordable, une mise en œuvre rapide et une performance suffisamment fiable pour justifier l’effort.
Il faut aussi un écosystème de réalisation. Un ménage ou une entreprise ne devient pas partenaire par décret. Il faut des produits accessibles, des installateurs compétents, des intégrateurs, des règles stables, des délais raisonnables, un accès clair à l’information, et une expérience suffisamment fluide pour que l’adoption atteigne l’échelle recherchée.
Cet écosystème ne se limite pas à la relation entre Hydro-Québec et l’usager. Il passe aussi par l’électricien du coin, par l’installateur, par l’intégrateur et, plus largement, par la formation des métiers spécialisés. La fluidité du parcours dépend donc aussi d’une capacité industrielle et professionnelle de terrain.
Sinon, même de bonnes idées restent des programmes modestes plutôt que de véritables leviers de transformation.
6. Pas de partenariat sans information
À partir du moment où les clients investissent dans des actifs énergétiques ou rendent des services au système, ils veulent voir ce qui se passe. Ils veulent des données, des tableaux de bord, des interfaces et des standards ouverts.
Des initiatives comme Green Button Alliance, très présente en Ontario, vont dans ce sens. À une autre échelle, des outils de suivi plus spécialisés, comme vadiMAP dans certains contextes chez Hydro-Québec, montrent aussi qu’un tableau de bord peut devenir une pièce concrète du partenariat, non seulement pour informer, mais aussi pour suivre la performance et soutenir le maintien de certains appuis financiers. Sans accès simple aux données, sans interopérabilité et sans transparence minimale, le partenariat reste incomplet.
Un exemple récent l’illustre bien. Hydro-Québec a interrompu temporairement son service en ligne Info-pannes pour une mise à jour alors que, à la suite de vents forts, quelques milliers d’usagers étaient privés d’électricité. Il n’y avait donc plus d’information disponible en ligne sur le rétablissement du service. À l’échelle du système, quelques milliers de clients en panne peuvent sembler peu de chose. Mais pour chacun des usagers touchés, la panne est totale. Dans ce contexte, l’information ne relève pas d’un service accessoire. Elle fait partie du service lui-même.
7. Le véhicule électrique change déjà la relation
Le véhicule électrique rend l’électricité plus visible, plus critique et plus comparée à d’autres expériences de service. Pour beaucoup de ménages, c’est aussi le premier investissement important qui transforme un simple usager en gestionnaire d’énergie, que ce soit à la recharge du véhicule ou en le conduisant. En ce sens, il devient souvent la première vraie porte d’entrée vers le statut de partenaire.
Or, certaines compagnies d’électricité canadiennes exploitent des réseaux de recharge parmi les meilleurs au pays, comme le Circuit électrique ou BC Hydro , tout en maintenant une relation encore fragmentée avec l’usager du service électrique traditionnel.
Cette séparation est une occasion manquée. Justement parce qu’il relie mobilité, recharge, tarification, flexibilité et, à terme, stockage, le véhicule électrique pourrait devenir l’un des principaux points d’entrée vers une relation de partenariat avec le système électrique.
8. Pourquoi le Québec est révélateur
Le Québec est un cas particulièrement intéressant : une grande compagnie d’électricité intégrée, production largement décarbonée, forte électrification des usages, avance historique dans l’adoption des véhicules électriques, et besoin croissant de flexibilité hivernale.
Sur l’autoproduction, Hydro-Québec a franchi un pas important au printemps 2026 en annonçant une aide de 1?000 $ par kilowatt installé, couvrant jusqu’à 40 % des coûts admissibles. Là encore, l’usager n’est plus simplement un consommateur captif. Il devient un investisseur potentiel dans l’écosystème électrique. Mais les subventions ne suffisent pas.
9. Ce qui devra changer
Le passage de l’abonné au partenaire est difficile pour des raisons culturelles et structurelles. Les compagnies d’électricité ont été conçues pour gérer des infrastructures lourdes, des réseaux centralisés, des normes uniformes et de très grands volumes de comptes. Elles sont beaucoup moins naturellement outillées pour des interactions fréquentes, des arbitrages distribués et des clients équipés d’actifs.
Passer de l’abonné au client exige une culture de service. Passer du client au partenaire exige davantage : une culture de cocréation de valeur avec l’usager, mais aussi une capacité d’orchestration d’un écosystème de produits, d’installateurs, d’intégrateurs, de données et de règles.
Il faudra donc mieux relier entre eux les univers aujourd’hui séparés : facturation, pannes, recharge de véhicules électriques, tarification dynamique, autoproduction, stockage, données de consommation, et relations avec le milieu et l’industrie.
Conclusion
L’industrie électrique ne change pas seulement de technologies. Elle change de relation avec ceux qu’elle dessert.
Pendant longtemps, les compagnies ont eu des abonnés. Ensuite, elles ont appris, souvent imparfaitement, à parler de clients. La prochaine étape est plus exigeante : elles devront apprendre à travailler avec des partenaires.
Le vrai enjeu n’est pas de savoir si les compagnies d’électricité veulent des partenaires.
Le vrai enjeu est qu’elles en ont déjà, mais qu’elles continuent souvent à les traiter comme des abonnés améliorés.
Hydro Québec a annoncé la semaine dernière avoir reçu 60 soumissions totalisant 481 MW dans le cadre de son premier appel d’offres solaire de 300 MW.
C’est un signal important pour toute l’industrie. Mais il faut éviter deux lectures simplistes : ni minimiser l’importance de cette étape ni conclure trop vite à l’émergence d’un marché mature.
Note : Ce texte a été relu avant publication par plusieurs personnes du secteur. Leurs commentaires ont permis d’en valider la solidité et la clarté. Elles se reconnaîtront.
Le solaire photovoltaïque entre officiellement dans le système énergétique québécois comme une composante reconnue et organisée. Ce n’est plus un sujet marginal ou expérimental.
La soumission de 60 projets, répartis dans 14 régions, avec une implication significative des communautés locales et autochtones, confirme qu’un écosystème est en train d’émerger.
Mais ce signal ne doit pas être confondu avec une industrialisation.
Un marché en émergence : concurrence réelle, mais encore limitée
Les soumissions totalisent 481 MW pour un appel d’offres de 300 MW. Il y a donc concurrence, mais elle demeure modérée.
Dans les marchés matures, la sursouscription est souvent beaucoup plus élevée, portée par des développeurs capables de multiplier les projets et d’opérer à grande échelle. Ici, le marché est encore en phase de structuration.
Deux caractéristiques ressortent.
D’abord, une concentration marquée. Quelques promoteurs ont déposé de véritables portefeuilles, totalisant plusieurs dizaines de MW chacun. Natural Forces , Innergex et NUTRINOR COOPÉRATIVE se distinguent, avec des ensembles de projets qui représentent environ les deux tiers du volume visé.
Ensuite, une longue traîne de petits projets. Une majorité de soumissionnaires ne présentent qu’un ou deux projets, souvent de taille limitée. Même certains acteurs structurés, comme BluEarth Renewables , ont privilégié une approche sélective.
Le tissu local est toutefois bien présent : 13 des 17 soumissionnaires sont basés au Québec, pour 28 projets totalisant 286 MW. Plusieurs acteurs d’ailleurs au Canada ont créé des entités dédiées pour opérer dans ce contexte.
La participation autochtone est également notable, avec une proportion importante de projets impliquant des communautés locales.
Enfin, l’absence relative de grands développeurs internationaux mérite d’être notée. Des acteurs comme EDF, Iberdrola , Enel Group ou NextEra ne sont pas présents. Cela peut contribuer à expliquer le niveau de concurrence observé et semble cohérent avec certaines contraintes de l’appel d’offres — notamment la taille des projets, la structure et les exigences — moins alignées avec des modèles de déploiement à grande échelle.
En synthèse : le marché existe et répond présent, mais il n’a pas encore atteint la profondeur et le niveau d’industrialisation observés ailleurs.
Un design d’appel d’offres qui structure et contraint le marché
Le point central réside dans la manière dont Hydro-Québec a structuré cet appel d’offres.
Les projets doivent être inférieurs à 25 MW et raccordés au réseau de distribution. Ils doivent également respecter des échéances strictes et des critères rigoureux en matière de contenu local, de retombées économiques, de partenariats et de spécifications techniques.
Ce design répond à des objectifs légitimes :
limiter les impacts sur le réseau
favoriser l’acceptabilité sociale
maximiser les retombées au Québec
Mais il a aussi des effets structurants et contraignants.
Il impose un modèle fragmenté, limite les économies d’échelle, complexifie la réalisation des projets, restreint le transfert de connaissances en provenance de marchés plus matures et s’accompagne d’exigences techniques serrées qui tendent à augmenter les coûts.
À cela s’ajoute un biais vers des équipements préqualifiés. Hydro-Québec maintient notamment une liste d’onduleurs admissibles. S’en écarter implique des validations supplémentaires (essais, rapports de laboratoire, exigences manufacturières), ce qui augmente le fardeau technique et les délais, tout en réduisant la flexibilité technologique. En pratique, cela limite la concurrence entre fournisseurs d’équipements et peut contraindre les promoteurs à retenir des solutions plus coûteuses ou moins optimisées, avec un impact direct sur le coût des projets.
Un modèle avec information incomplète
Un élément plus subtil, mais important, concerne l’information disponible sur le réseau.
Dans le modèle actuel, les soumissionnaires avancent avec une information partielle sur la capacité du réseau. Les études détaillées d’intégration sont réalisées après le dépôt des soumissions.
À bien des égards, cela ressemble à une partie de «?Battleship?» : on choisit un point, on soumet… et on découvre après coup si l’emplacement était viable.
Ce n’est pas un hasard complet. Les promoteurs s’appuient sur un ensemble de règles et de repères empiriques pour guider leurs choix. Mais l’incertitude demeure significative.
À titre de comparaison, en Ontario, des informations sur la capacité disponible du réseau de distribution sont rendues publiques, notamment pour les lignes de moyenne tension. À l’inverse de la logique de «?Battleship?», cette transparence revient à jouer avec une carte où l’emplacement des cibles est en partie visible avant de tirer : l’incertitude diminue en amont et l’allocation des projets s’en trouve nettement améliorée.
Le coût caché : le transfert de risque
Une part importante du risque est ainsi transférée aux promoteurs :
obtention des permis
raccordement
respect du calendrier
incertitude sur l’intégration réseau
Ce choix est cohérent du point de vue d’Hydro-Québec.
Conséquence mécanique : les promoteurs intègrent ces risques dans leurs prix.
Autrement dit, en tentant de réduire le risque de la compagnie d’électricité, le système dans son ensemble augmente le coût des projets.
Un cadre de financement plus contraignant
Les questions soumises dans le cadre de l’appel d’offres sont révélatrices.
Plusieurs portent sur la structure des revenus, les clauses contractuelles ou les mécanismes de compensation.
Ce sont des signaux classiques d’un enjeu de financement.
Dans ce contexte :
le coût du capital augmente
les marges de sécurité sont plus élevées
L’incertitude sur l’intégration au réseau vient amplifier ce phénomène : en l’absence de visibilité ex ante sur la capacité et les coûts d’intégration, les promoteurs et leurs financiers doivent intégrer une prime de risque supplémentaire.
Résultat : le prix du kWh en reflète une partie.
Un processus long, révélateur des contraintes
Il faut aussi regarder le facteur temps.
Le processus s’étend sur plusieurs années :
préparation vraisemblablement amorcée après le Plan d’action 2035 (2023)
accélération à la suite du décret no 1376?2024
appel d’offres publié en 2025
soumissions déposées en 2026
décision attendue en 2027
mise en service prévue en 2029
Autrement dit, six ans entre l’impulsion initiale et la production d’électricité.
Ce délai est long en comparaison des régions où le solaire est mature, mais il reflète la réalité du cadre québécois :
exigences réglementaires
coordination réseau
acceptabilité sociale
structuration d’un marché émergent
Dans ce contexte, la lenteur relative du processus est aussi le résultat d’un choix de prudence.
Cela dit, si l’objectif de 3?000 MW de solaire d’ici 2035 est maintenu, le rythme devra s’accélérer de manière significative, notamment par des actions concrètes comme la préqualification de points de raccordement, la publication de la capacité disponible sur le réseau, la standardisation accrue des contrats, l’augmentation de la taille des appels d’offres et la simplification des processus d’autorisation.
Comparaison utile : l’Ontario
Le contraste avec l’Ontario est instructif.
En avril 2026, l’Ontario a annoncé des contrats totalisant 1?315 MW (solaire et éolien) à un coût moyen d’environ 8,8 ¢/kWh.
Plusieurs éléments ressortent :
des volumes beaucoup plus importants
une concurrence plus large
un écosystème déjà développé
Sans être un marché parfaitement mature, l’Ontario dispose d’une base industrielle plus avancée dont le Québec pourrait s’inspirer.
On observe ainsi deux approches : une approche prudente et fortement encadrée au Québec, et une approche plus industrialisée en Ontario, davantage axée sur la mise à l’échelle et la réduction des coûts.
Ces différences influencent directement les coûts, les délais et la capacité à passer à l’échelle.
Conclusion
Cet appel d’offres marque une étape importante.
Il permet d’introduire le solaire dans le système québécois dans un cadre structuré et prudent.
Mais il met aussi en évidence les défis à venir : coûts, délais, capacité d’exécution et structuration de l’écosystème.
Le solaire n’est pas intrinsèquement coûteux.
Mais la façon dont on choisit de l’intégrer au système peut l’être.
La prochaine étape sera déterminante : passer d’un projet pilote encadré à une véritable capacité de déploiement à grande échelle.
Hydro Québec announced last week that it had received 60 bids totalling 481 MW for its first 300 MW solar call for tenders.
This is an important signal for the entire industry. But we must avoid two simplistic readings: neither minimizing the importance of this step nor concluding too quickly that a mature market is emerging.
Note: This text has been proofread by people in the industry before publication. Their comments validated its robustness and clarity. They may recognize themselves in this acknowledgement.
Solar photovoltaics is now formally entering Québec’s energy system as a recognized and organized component. It is no longer a marginal or experimental topic.
The submission of 60 projects, spread across 14 regions, with significant involvement from local and Indigenous communities, confirms that an ecosystem is beginning to emerge.
But this signal should not be mistaken for industrialization.
An emerging market: real competition, but still limited
The submissions total 481 MW for a 300 MW procurement. There is competition, but it remains moderate.
In mature markets, oversubscription is typically much higher, driven by developers capable of scaling and replicating projects.
Here, the market is still in a structuring phase.
Two characteristics stand out.
First, strong concentration. A few developers submitted full portfolios totalling tens of MW each. Natural Forces , Innergex and NUTRINOR COOPÉRATIVE stand out, with combined portfolios representing roughly two thirds of the targeted volume.
Second, a long tail of small projects. Most bidders submitted only one or two projects, often of limited size. Even structured players like BluEarth Renewables adopted a selective approach.
The local base is nonetheless strong: 13 of the 17 bidders are Québec-based, representing 28 projects and 286 MW. Several Canadian players created dedicated entities to operate in this context.
Indigenous participation is also notable, with a significant share of projects involving local communities.
Finally, the relative absence of large international developers is worth noting. Players such as EDF, Iberdrola , Enel Group or NextEra are not present. This may help explain the level of competition observed and appears consistent with certain features of the procurement design—particularly project size, structure, and requirements—which are less aligned with large-scale industrial deployment models.
In summary, the market exists and is responding, but it has not yet reached the depth and level of industrialization seen elsewhere.
A procurement approach that structures and constrains the market
The central issue lies in how Hydro-Québec structured this procurement.
Projects must be under 25 MW and connected to the distribution network. They must also meet strict timelines and rigorous requirements regarding local content, economic benefits, partnerships, and technical specifications.
This design serves legitimate objectives:
limiting impacts on the grid
ensuring social acceptability
maximizing local economic benefits
But it also has structuring and constraining effects.
It imposes a fragmented model, limits economies of scale, increases project complexity, restricts knowledge transfer from more mature markets, and introduces tight technical requirements that tend to increase costs.
In addition, there is a bias toward prequalified equipment. Hydro-Québec maintains a list of approved inverters. Deviating from this list requires additional validation (testing, lab reports, manufacturer requirements), increasing technical burden and timelines while reducing technological flexibility. In practice, this limits competition among equipment suppliers and may force developers to select more expensive or less optimized solutions, directly impacting project costs.
A model with incomplete information
A more subtle but critical issue concerns the availability of grid information.
In the current model, bidders move forward with partial information on grid capacity. Detailed integration studies are conducted only after submissions are filed.
In many ways, this resembles a game of “Battleship”: you pick a location, submit… and only later find out whether the site was viable.
This is not purely random. Developers rely on rules and empirical heuristics. But uncertainty remains significant.
By contrast, in Ontario, information on available distribution capacity—particularly on medium-voltage lines—is publicly available. Unlike the “Battleship” approach, this transparency is akin to playing with a map where target locations are partially visible before making a move: uncertainty is reduced upfront, and project allocation improves significantly.
The hidden cost: risk transfer
A significant portion of risk is transferred to developers:
permitting
interconnection
schedule compliance
grid integration uncertainty
This approach is coherent from Hydro-Québec’s perspective.
But it has a mechanical effect: developers incorporate these risks into their pricing.
To put it another way, when the utility lowers its own risk, it ultimately leads to higher overall project costs.
A more constrained financing environment
The questions submitted during the procurement process are revealing.
Many relate to revenue structure, contractual clauses, and compensation mechanisms.
These are typical indicators of financing concerns.
In this context:
cost of capital increases
risk buffers grow
Uncertainty around grid integration amplifies this effect: without ex ante visibility on capacity and integration costs, developers and lenders must incorporate an additional risk premium.
Result: part of this is reflected in the price per kWh.
A long process, reflecting structural constraints
Time is also a critical factor.
The process spans several years:
likely initiated after the 2035 Action Plan (2023)
accelerated following decree no. 1376–2024
procurement launched in 2025
bids submitted in 2026
decision expected in 2027
commissioning planned for 2029
In other words, roughly six years between initial policy direction and electricity production.
This timeline is long compared to more mature solar markets, but it reflects Québec’s institutional context:
regulatory requirements
grid coordination
social acceptability
structuring of an emerging market
In this context, the slower pace also reflects a deliberate choice for prudence.
That said, if the target of 3,000 MW of solar by 2035 is to be met, the pace will need to accelerate significantly. This will likely require concrete actions such as prequalifying interconnection points, publishing available grid capacity, standardizing contracts, increasing procurement sizes, and simplifying permitting processes.
A useful comparison: Ontario
The contrast with Ontario is instructive.
In April 2026, Ontario awarded contracts totalling 1,315 MW (solar and wind) at an average cost of approximately 8.8¢/kWh.
Several elements stand out:
much larger volumes
broader competition
a more developed ecosystem
While not a fully mature market, Ontario benefits from a more advanced industrial base from which Québec could draw lessons.
Two approaches emerge: a cautious and tightly structured model in Québec, and a more industrialized, scale-driven approach in Ontario focused on cost reduction.
These differences directly influence costs, timelines, and the ability to scale.
Conclusion
This procurement marks an important step.
It introduces solar into Québec’s system in a structured and cautious manner.
But it also highlights the challenges ahead: costs, timelines, execution capacity, and ecosystem development.
Solar is not inherently expensive.
But the way it is integrated into the system can be.
The next phase will be decisive: moving from a controlled pilot approach to true large-scale deployment.
As early as 2020, Premier François Legault described Québec as the “green battery of Northeastern America”, referring to Hydro-Québec’s large reservoirs.
It is a powerful image. And for a long time, it was an accurate one.
It captured a simple reality: Hydro Québec could store energy, wait for the right moments, and sell when prices rose.
But that image belongs to a world in which flexibility was scarce.
That world is changing.
With batteries being deployed rapidly across the U.S. grid, one question now arises:
To understand the risk, we need to start with the numbers.
In 2025, Hydro-Québec:
exported 11.8 TWh at 14.5¢/kWh, or about C$1.7 billion in revenue;
imported 15.2 TWh at 7.6¢/kWh, or about C$1.15 billion in costs.
So it imported more than it exported.
And yet, it still made money.
On the order of C$500 million to C$600 million on those transactions.
That is the central point.
Hydro-Québec does not make its money by exporting a lot. It makes its money by exporting at the right time.
What that means
Hydro-Québec is not just an exporter.
It is an arbitrage player.
Its model is simple:
buy when prices are low;
sell when prices are high;
capture the spread.
That is where the profit comes from.
Not from volume. From timing.
What batteries change
A recent Canary Media article on New England shows that battery deployment has entered a new phase: projects in the hundreds of megawatts are now moving ahead, with 175 MW and 250 MW facilities already online, and a 700 MWproject in development.
This is no longer marginal. These are system-shaping assets.
Most importantly, these batteries target exactly the same value Hydro-Québec has been capturing:
they charge when prices are low;
they sell when prices are high;
they operate during peak hours, when the value is highest.
In other words, they do not complement Hydro-Québec’s model. They compete with it directly.
Their business model also relies on market arbitrage, supported by public policy and by a favourable environment of high prices and growing demand.
These batteries do exactly what Hydro-Québec does, but locally, in the Northeast states.
It is the price spread that made the model so valuable.
Hydro-Québec is not being replaced
Still, we should avoid the wrong conclusion.
Batteries do not replace reservoirs.
They are excellent over a few hours. Much less so over several days. Even less so across seasons.
Hydro-Québec therefore retains an essential role.
But that role is changing.
Less:
daily arbitrage;
frequent and predictable revenue.
More:
value during rare events;
long-term value tied to duration.
Conclusion
The “Battery of the Northeast” remains a useful image.
But it describes the source of value less and less well.
Batteries are not replacing Hydro-Québec. They are redefining the part of its model that used to generate returns most easily.
The challenge facing Hydro-Québec CEO Claudine Bouchard, ASC is enormous. She must lead the largest buildout in Hydro-Québec’s history at the very moment when the value once captured by the “Battery of the Northeast” is beginning to migrate toward batteries deployed locally, closer to the markets.
Dès 2020, le premier ministre François Legault a décrit le Québec comme la «?batterie verte du Nord-Est de l’Amérique?», en référence aux grands réservoirs d’Hydro-Québec.
L’image est forte. Et elle a longtemps été juste.
Elle décrivait bien une réalité simple : Hydro Québec pouvait stocker de l’énergie, attendre les bons moments, puis vendre lorsque les prix montaient.
Mais cette image appartient à un monde où la flexibilité était rare.
Ce monde change.
Avec l’arrivée rapide des batteries sur le réseau étatsunien, une question se pose :
Et si cette batterie était en train d’être court-circuitée??
Pour comprendre le risque, il faut partir des chiffres.
En 2025, Hydro-Québec :
exporte 11,8 TWh à 14,5 ¢/kWh, soit environ 1,7 G$ de revenus?;
importe 15,2 TWh à 7,6 ¢/kWh, soit environ 1,15 G$ de coûts.
Donc, elle importe plus qu’elle n’exporte.
Et pourtant, elle fait de l’argent.
De l’ordre de 500 à 600 M$ sur ces transactions.
C’est le point central.
Hydro-Québec ne fait pas son argent en exportant beaucoup. Elle le fait en exportant au bon moment.
Ce que ça veut dire
Hydro-Québec n’est pas qu’un exportateur.
C’est un arbitragiste.
Son modèle est simple :
acheter quand les prix sont bas?;
vendre quand ils sont élevés?;
capter l’écart.
Le profit vient de là.
Pas du volume. Du moment.
Ce que les batteries changent
Un article récent de Canary Media sur la Nouvelle-Angleterre montre que le déploiement des batteries est entré dans une nouvelle phase : des projets de centaines de MW se succèdent, avec des installations de 175 MW et 250 MW déjà en service, et un projet de 700 MW en développement.
Ce n’est plus marginal. Ce sont des actifs structurants du système.
Et surtout, ces batteries visent exactement la même valeur que celle captée par Hydro-Québec :
elles chargent quand les prix sont bas?;
elles vendent quand les prix sont élevés?;
elles interviennent pendant les heures de pointe, quand la valeur est maximale.
Autrement dit, elles ne complètent pas le modèle d’Hydro-Québec. Elles le concurrencent directement.
Leur modèle économique repose lui aussi sur l’arbitrage de marché, soutenu par des politiques publiques et par un contexte favorable de prix élevés et de forte demande.
Ces batteries font exactement ce que fait Hydro-Québec, mais localement, dans les états du Nord-Est.
Le cœur du modèle est attaqué
Reprenons l’équation :
profit ? (export × prix élevé) ? (import × prix bas).
Si les batteries :
réduisent les pointes?;
relèvent les prix hors pointe?;
compressent les écarts?;
alors elles réduisent directement le profit.
Ce qu’elles court-circuitent, ce n’est pas l’hydroélectricité.
C’est l’écart de prix qui faisait la valeur du modèle.
Hydro-Québec n’est pas remplacée
Il faut toutefois éviter le contresens.
Les batteries ne remplacent pas les réservoirs.
Elles excellent sur quelques heures. Beaucoup moins sur plusieurs jours. Encore moins sur des saisons.
Hydro-Québec garde donc un rôle essentiel.
Mais ce rôle change.
Moins :
d’arbitrage quotidien?;
de revenus fréquents et prévisibles.
Plus :
de valeur sur les événements rares?;
de valeur de long terme liée à la durée.
Conclusion
La «?batterie du Nord-Est?» reste une image pertinente.
Mais elle décrit de moins en moins bien la source de valeur.
Les batteries ne remplacent pas Hydro-Québec. Elles redéfinissent la partie de son modèle qui rapportait le plus facilement.
Le défi de Claudine Bouchard, ASC, PDG d’Hydro-Québec, est colossal. Elle doit piloter le plus grand chantier de l’histoire d’Hydro-Québec au moment même où la valeur que captait la «?batterie du Nord-Est?» commence à migrer vers des batteries déployées localement, au plus près des marchés.
Energy debates often remain trapped in a simple logic: if demand rises, more generation capacity must be built, especially to meet peaks.
Energy efficiency and conservation efforts can, of course, slow the pace of new capacity additions. But they do not change the underlying issue: we still need to decide how to organize the system.
The implicit response to rising demand is, therefore, to build new power plants and the associated transmission infrastructure. In Québec, that typically points to new large hydropower projects.
This is precisely the logic that the hydro-solar-batteries triplet invites us to rethink. Its value lies not only in adding assets, but also in better managing, across time and space, the electricity the system can produce.
This article deliberately stays at the system level. It does not go into the different solar and battery segments, whether residential, commercial, industrial, or utility scale. Those distinctions deserve an article of their own.
Today, for peak capacity, new hydropower peaking plants no longer appear fully competitive with batteries. At comparable power capacity, batteries offer lower costs, much shorter deployment timelines, and far greater operational flexibility.
So this is no longer just a technological complement. In some cases, batteries are becoming a credible, and often preferable, alternative to new peaking plants.
For illustration:
Tomago (Australia): a 500 MW, 2,000 MWh battery, about A$800 million (? C$750 million), or roughly C$1.5 million per MW installed, with a delivery timeline of about two years.
Churchill Falls Expansion (Labrador): a 1,100 MW peaking plant, with an estimated cost of C$4.6 billion including financing, or nearly C$4.2 million per MW, excluding the additional transmission line, relying on the existing reservoir, with commissioning planned for 2035.
At comparable power capacity, the gap is significant: roughly a factor of three in cost per MW, on top of radically different timelines and execution complexity.
The decisive difference, however, lies in how each asset is used. A peaking plant is dispatched for only a few dozen hours per year. A battery, by contrast, is used continuously to arbitrage across time, stabilize the grid, and manage peaks.
That versatility changes the nature of the investment: we move from a specialized asset used only marginally to a multi-purpose asset that is called upon continuously.
Moving Energy Through Time… And Space
In practical terms, the system can work differently.
Outside peak periods, electricity is produced in the north from hydropower, or in the south from solar and wind. That energy is then transported and stored in batteries, particularly near load centres.
During peak periods, that energy is discharged locally.
This mechanism reduces stress on the grid, lowers dependence on peak-oriented infrastructure, and makes better use of existing assets.
It also makes it possible to absorb occasional excess generation, for example, when spring freshets, strong wind output, and strong solar output on mild days occur at the same time. In that case, the energy is stored and redistributed later, when it can be consumed.
A Systemic Effect: Once Installed, Batteries Change Everything
A battery installed for the winter peak does not serve only in cold weather.
It becomes a central system asset:
It smooths solar output on a daily basis.
It enables arbitrage between off-peak and peak hours.
It supports grid frequency and stability.
It reduces cycling and wear on turbine-generator sets.
Above all, it makes it possible to reserve hydropower for what it does best: seasonal storage and long-duration management.
That potential, however, can only be fully realized if the whole system is operated in an integrated way. Forecasting hydro inflows, solar and wind output, anticipating demand, coordinating generation, and managing battery charging and discharging cycles: the triplet raises the system’s optimization requirements. This raises the value of more advanced tools, and also opens up relevant uses for artificial intelligence.
Solar: Low-Cost Fuel for the System
Solar plays a key role in the triplet proposed for Québec.
Its strength is twofold: it can be deployed quickly, and it provides low-cost energy. In Australia, installed solar costs have now fallen to levels low enough to change the economics of the power system. Expressed in power terms, they are on the order of C$1.1 to C$1.5 million per MW, while providing additional energy at very low cost.
These costs also reflect a development, installation, and interconnection ecosystem that is now highly mature in Australia. They therefore do not automatically translate to Québec, where solar is still at an early stage. But they do show what becomes achievable as the sector matures.
It is also worth noting that Hydro-Québec has recently taken an important step in this direction, by launching financial support for the purchase of solar panels and setting a target of 125,000 self-generating customers by 2035.
In this architecture, solar produces mostly in summer and, of course, during the day. That energy can be used immediately, shifted within the day thanks to batteries, or indirectly carried forward to winter by reducing hydropower output and allowing more water to be stored in reservoirs.
Solar is, therefore, not just an additional source of generation. It is a low-cost resource whose value can be shifted within the system. It reduces the immediate use of hydropower and increases the value of storing electricity in batteries.
An Illuminating Economic Comparison
This complementarity is also reflected in broad economic orders of magnitude.
We can push the reasoning a bit further with the proposed Gull Island hydro generating station in Labrador. The project targets 2,250 MW, about 12 TWh of dispatchable annual generation, and an estimated cost of C$24.9 billion.
Using, for illustration, a battery cost of about C$1.5 million per MW, an equivalent 2,250 MW of battery capacity would represent about C$3.4 billion. This comparison with battery costs remains imperfect: it captures well the value of daily modulation, but not the full sustained support capability that hydropower plants can provide over several days. Even so, if we attribute that portion of Gull Island’s cost to its power and dispatch function, more than C$21 billion remains to be explained for the energy function. That is a large amount for 12 TWh.
Using reasonable working assumptions inspired by costs observed in Australia, an annual volume of solar energy equivalent to 12 TWh could be deployed for about C$11 to C$14 billion, which would correspond to roughly 9,100 MW installed, based on an approximately 15% capacity factor that can be expected in Québec. About half the cost of Gull Island.
This exercise is not a perfect equivalence. 9,100 MW of solar capacity would be a very large build-out. Gull Island also provides dispatchable output and winter value that solar alone cannot provide. But it highlights an important point: once the flexibility function is isolated, even approximately, the “energy” component of a large hydropower project such as Gull Island appears more expensive than a solar alternative producing the same annual volume.
Hydropower: from Flexible Assets to Strategic Reserve
In this context, the role of hydropower evolves.
It remains essential, but its use becomes more strategic.
Rather than being called on continuously for short-term flexibility, it can be increasingly reserved for:
Seasonal management.
Prolonged periods of low solar or wind output.
System security.
This reduces the mechanical stress associated with frequent cycling and maximizes the value of an asset that already exists.
And Wind?
Wind fits naturally into this logic.
Its output, often higher in winter, is particularly useful in Québec’s context. But, like solar, it increases the value of storing electricity in batteries and of flexibility.
It does not compete with the triplet. It strengthens it. Perhaps we should speak of a quadruplet.
A Different Economic Logic
From an economic and energy planning perspective, the triplet changes the nature of investment.
It makes it possible to substitute some heavy, slow-to-deploy, and lightly used infrastructure with modular, rapidly installed, multi-purpose assets.
It also improves system management and the pacing of investment. Because solar and batteries can be deployed in stages, it becomes easier to slow down or accelerate depending on actual demand growth, cost trends, grid constraints, or energy-efficiency gains.
It also strengthens Hydro-Québec’s arbitrage capacity in neighbouring electricity markets, whose model already relies in part on exporting during peak periods and importing off-peak, in addition to long-term contracts.
Conclusion: a Machine for Travelling Through Time
At heart, the hydro-solar-batteries triplet turns the electricity system into a time travel machine.
It makes it possible to decide when to produce, when to store electricity in batteries, and when to use it.
In a context of uncertainty, growing demand, and deployment constraints, that capability becomes more valuable than the simple addition of capacity.
The issue is, therefore, no longer just producing more. It is better exploiting, across time and space, the electricity we are capable of producing, and extracting more value from it.
Le débat énergétique reste souvent enfermé dans une logique simple : si la demande augmente, il faudrait construire davantage de capacité de production, notamment pour répondre aux pointes.
Les efforts d’efficacité énergétique et de sobriété peuvent bien sûr ralentir le rythme d’ajout de nouvelles installations. Mais ils ne changent pas le fond du problème : il faut quand même décider comment organiser le système.
La réponse implicite à l’augmentation de la demande consiste alors à construire de nouvelles centrales et les infrastructures de transport associées. Au Québec, cela renvoie typiquement à de nouveaux projets hydroélectriques d’envergure.
C’est précisément cette logique que le triplet hydro–solaire–batteries invite à revoir. Son intérêt n’est pas seulement d’ajouter des actifs, mais de mieux gérer dans le temps et dans l’espace l’électricité que le système peut produire.
Le présent texte reste volontairement à un niveau systémique. Il n’entre pas dans le détail des différents segments du solaire et des batteries, qu’il s’agisse des installations résidentielles, commerciales, industrielles ou des parcs à grande échelle. Ces distinctions mériteraient un article à part entière.
Aujourd’hui, pour la capacité de pointe, les nouvelles centrales hydroélectriques ne semblent plus pleinement concurrentielles face aux batteries. À puissance comparable, ces dernières offrent des coûts plus faibles, des délais de déploiement beaucoup plus courts et une flexibilité d’usage nettement supérieure.
Il ne s’agit donc plus seulement d’un complément technologique. Dans certains cas, les batteries deviennent une alternative crédible, et souvent préférable, aux nouvelles centrales de pointe.
À titre indicatif :
Tomago (Australie) : batterie de 500 MW, 2?000 MWh, environ 800 M$ AUD (? 750 M$ CAD), soit environ 1,5 M$ par MW installé, avec un délai de réalisation de l’ordre de deux ans.
Churchill Falls Expansion (Labrador): centrale de pointe de 1?100 MW de puissance, coût estimé de 4,6 G$ CAD (incluant financement), soit près de 4,2 M$ par MW, sans compter la ligne de transport supplémentaire, en s’appuyant sur le réservoir existant, avec une mise en service prévue en 2035.
À puissance comparable, l’écart est significatif : environ un facteur trois sur le coût par MW, auquel s’ajoutent des délais et une complexité de réalisation sans commune mesure.
La différence déterminante tient toutefois à l’usage. Une centrale de pointe est mobilisée pendant quelques dizaines d’heures par année. Une batterie, elle, est utilisée en continu pour arbitrer dans le temps, stabiliser le réseau et gérer les pointes.
C’est cette polyvalence qui change la nature de l’investissement : on passe d’un actif spécialisé, utilisé de façon marginale, à un actif multi-usage, sollicité en permanence.
Déplacer l’énergie dans le temps… et dans l’espace
Concrètement, le système peut fonctionner autrement.
En dehors des pointes, l’électricité est produite au nord à partir de l’hydroélectricité, ou au sud à partir du solaire et de l’éolien. Cette énergie est ensuite transportée et stockée dans des batteries, notamment à proximité des centres de consommation.
En période de pointe, cette énergie est restituée localement.
Ce mécanisme permet de limiter la charge du réseau, de réduire la dépendance à des infrastructures de pointe et de mieux utiliser les actifs existants.
Il permet aussi d’absorber les excédents éventuels de production, par exemple lorsque les crues printanières, une forte production éolienne et une forte production solaire lors de journées clémentes se combinent. Dans ce cas, l’énergie est stockée pour être redistribuée plus tard, lorsque sa consommation est possible.
Un effet systémique : une fois installées, les batteries changent tout
Une batterie installée pour la pointe hivernale ne sert pas seulement par temps froid.
Elle devient un actif central du système :
Elle lisse la production solaire au quotidien.
Elle permet l’arbitrage entre heures creuses et heures de pointe.
Elle soutient la fréquence et la stabilité du réseau.
Elle réduit les cycles et l’usure des groupes turboalternateurs.
Surtout, elle permet de réserver l’hydroélectricité à ce qu’elle fait le mieux : le stockage saisonnier et la gestion sur de longues durées.
Ce potentiel ne pourra toutefois être pleinement réalisé que si l’ensemble est piloté de façon intégrée. Prévision des apports hydriques, solaires et éoliens, anticipation de la demande, coordination de la production et des cycles de charge et de décharge des batteries : le triplet accroît les exigences d’optimisation du système. Cela renforce la valeur d’outils de conduite plus sophistiqués, et ouvre aussi la porte à des usages pertinents de l’intelligence artificielle.
Le solaire : un carburant à faible coût pour le système
Le solaire joue un rôle clé dans le triplet proposé pour le Québec.
Sa force est double : il peut être déployé rapidement, et il fournit une énergie peu coûteuse. En Australie, les coûts installés du solaire se situent maintenant à des niveaux suffisamment bas pour changer l’économie du système électrique. Exprimés en puissance, ils sont de l’ordre de 1,1 à 1,5 M$ CAD par MW, tout en fournissant une énergie additionnelle à très faible coût.
Ces coûts reflètent aussi un écosystème de développement, d’installation et de raccordement désormais bien rodé en Australie. Ils ne se transposent donc pas automatiquement au Québec, où le solaire est embryonnaire. Ils montrent toutefois ce qu’il devient possible d’atteindre lorsque la filière gagne en maturité.
Il faut d’ailleurs souligner qu’Hydro-Québec vient de franchir un pas important dans cette direction, avec le lancement d’un appui financier à l’achat de panneaux solaires et un objectif affiché de 125?000 clients autoproducteurs à l’horizon 2035.
Dans cette architecture, le solaire produit surtout en été, et évidemment en journée. Cette énergie peut être utilisée immédiatement, déplacée dans la journée grâce aux batteries, ou indirectement reportée à l’hiver en réduisant la production hydroélectrique et en permettant d’accumuler davantage d’eau dans les réservoirs.
Le solaire n’est donc pas seulement une production additionnelle. C’est une ressource peu coûteuse dont la valeur peut être déplacée dans le système. Elle réduit l’usage immédiat de l’hydroélectricité et accroît la valeur du stockage dans des batteries.
Une comparaison économique éclairante
Cette complémentarité se reflète aussi dans les ordres de grandeur économiques.
On peut pousser le raisonnement un peu plus loin avec la centrale proposée de Gull Island, au Labrador. Le projet vise 2?250 MW, une production annuelle pilotable d’environ 12 TWh et un coût estimé de 24,9 G$.
Si l’on retient, à titre indicatif, un coût de batterie d’environ 1,5 M$ par MW, une capacité équivalente de 2?250 MW représenterait environ 3,4 G$. Cette comparaison avec le coût des batteries reste imparfaite : elle capture bien la valeur de la modulation quotidienne, mais non toute la capacité de soutien prolongé qu’un aménagement hydroélectrique peut fournir sur plusieurs jours. Malgré tout, en attribuant cette portion du coût de Gull Island à sa fonction de puissance et de pilotage, il resterait plus de 21 G$ à expliquer pour la fonction énergie. C’est beaucoup pour 12 TWh.
Avec des hypothèses de travail raisonnables inspirées des coûts observés en Australie, un volume annuel d’énergie solaire équivalent à 12 TWh pourrait être déployé pour un coût de l’ordre de 11 à 14 G$, ce qui correspondrait à environ 9?100 MW installés, sur la base d’un facteur d’utilisation d’environ 15 % auquel on peut s’attendre au Québec. Presque la moitié de Gull Island.
L’exercice n’est pas une équivalence parfaite. Une capacité solaire de 9?100 MW représente un volume considérable. Gull Island apporte aussi une production pilotable et une valeur hivernale que le solaire n’offre pas à lui seul. Mais il met en évidence un point important : une fois isolée, même approximativement, de sa fonction de flexibilité, la composante «?énergie?» d’un grand projet hydroélectrique comme Gull Island apparaît plus coûteuse qu’une alternative solaire produisant le même volume annuel.
L’hydroélectricité : d’actif flexible à réserve stratégique
Dans ce contexte, le rôle de l’hydro évolue.
Elle demeure essentielle, mais son utilisation devient plus stratégique.
Plutôt que d’être sollicitée en continu pour la flexibilité de court terme, elle peut être davantage réservée à :
la gestion saisonnière.
Les périodes prolongées de faible production solaire ou éolienne.
La sécurité du système.
Cela réduit les contraintes mécaniques liées aux cycles fréquents et maximise la valeur d’un actif déjà en place.
Et l’éolien??
L’éolien s’intègre naturellement à cette logique.
Sa production, souvent plus importante en hiver, est particulièrement utile dans le contexte québécois. Mais, comme le solaire, il accroît la valeur du stockage dans des batteries et de la flexibilité.
Il ne s’oppose pas au triplet. Il en renforce la pertinence. Peut-être devrait-on parler de quadruplet.
Une logique économique différente
Sur le plan économique et de planification énergétique, le triplet change la nature des investissements.
Il permet de substituer une partie des infrastructures lourdes, longues à déployer et faiblement utilisées, par des actifs modulaires, rapides à installer et multi-usages.
Il améliore aussi le pilotage du système et du rythme d’investissement. Parce que le solaire et les batteries peuvent être déployés par étapes, il devient plus facile de ralentir ou d’accélérer selon l’évolution réelle de la demande, des coûts, des contraintes réseau ou des gains d’efficacité énergétique.
Il renforce aussi la capacité d’arbitrage d’Hydro-Québec sur les marchés voisins de l’électricité, dont le modèle repose déjà en partie sur l’exportation en période de pointe et l’importation hors pointe, en complément de contrats à long terme.
Conclusion : une machine à voyager dans le temps
Au fond, le triplet hydro–solaire–batteries transforme le système électrique en une machine à voyager dans le temps.
Il permet de décider quand produire, quand stocker l’électricité dans des batteries et quand l’utiliser.
Dans un contexte d’incertitude, de croissance de la demande et de contraintes de déploiement, cette capacité devient plus précieuse que la simple addition de capacité.
L’enjeu n’est donc plus seulement de produire plus. Il est de mieux exploiter, dans le temps et dans l’espace, l’électricité que nous sommes capables de produire, et d’en extraire davantage de valeur.
It is good to see Hydro?Québec finally supporting the expansion of solar.
Since March 31, 2026, Hydro Québec has been offering a subsidy for solar panels, with a target of 125,000 prosumers. Today, there are roughly 1,000. This signal is critical to kick-start a market.
Fifteen years ago, at Hydro One, I worked on business modelling for the smart grid transformation.
At the time:
More than 25,000 residential and commercial PV installations were already in place.
Utility-scale solar plants were connected directly to the distribution grid.
What Québec is now beginning to consider was already being deployed elsewhere more than a decade ago.
A Clear Global Trajectory
Solar is now the fastest-growing source of electricity worldwide. Including in regions comparable to Québec.
Take Sweden:
Similar population.
Further north.
Lower level of final electrification.
By the end of 2025: ~5.4 GW of solar generation installed.
That is the same order of magnitude as what Québec projects in its integrated energy system plan (PGIRE)… for 2050.
And Sweden is still accelerating by simplifying permitting.
The message is clear: solar is not marginal. It is structural.
The Australian Example
To understand the gap, look at a market that has already gone through this phase.
Australia shares several characteristics with Canada: large territory, abundant resources, a developed economy, and a historically centralized power system.
Utility scale: ~AUD 1,600/kW (~CAD 1,500/kW), going down to $ 1,000 by 2035.
Rooftop: ~AUD 1,200/kW (~CAD 1,100/kW), approaching $ 1,000 by 2035.
Approaching $1/W, before subsidies. Surprisingly, rooftop solar is cheaper to build per kW, although annual generation (kWh/kW) is better for larger, better-optimized solar farms.
Why these costs in Australia?
Global industrialization of modules.
Standardization.
Repetition.
Installation ecosystem.
Volume.
Solar is modular: the more you build, the simpler and cheaper it gets.
A large share of costs is local (installation, engineering, permitting). These decline with experience.
In Canada/Québec: ~1.6 to $3.0/W, with rooftop more expensive.
This is not structural.
It is an ecosystem gap.
A Misunderstood Difference
The key factor is speed.
Solar is built in weeks or months for customer installations, or a couple of years for large-scale projects. Major hydro projects take 10–15 years.
With the same technology, installation is broadly comparable across geographies, even if slowed in winter. Sunshine and climate are often cited. They are not the main issue.
The real difference:
Australia has been building for 15 years.
Québec is just starting.
Solar is not cheap where there is more sun. It is cheap where it is actually deployed.
Underestimated Advantages
Solar complements hydro: distributed production, predictable costs, and contribution during cold. Coupled with batteries, it reduces pressure on turbines and peak demand, especially as the coldest days are usually sunny.
Result: better social acceptability and, more importantly, much greater flexibility.
In mid-transition, this creates optionality.
With small, fast projects, you can slow down, stop, or resize without major sunk costs. Mistakes are cheaper. Large projects concentrate risk.
In an uncertain environment, this becomes a strategic advantage.
What This Implies
Solar is also an industrial project: installation, engineering, grid integration, partial manufacturing. Deployment builds capabilities and companies locally, creating value here.
Three takeaways:
Solar is not experimental. It is already deployed at scale.
Costs depend on volume and on the ecosystem built through experience.
The constraint is institutional and organizational, not technological.
What Next?
Québec can catch up quickly, provided we do what worked elsewhere:
Move from pilots to sustained, predictable programs.
Simplify and standardize.
Learn by deploying.
Treat solar as a normal component of the system.
The tipping point is simple: When treated as an industry, solar becomes competitive.
Il est bon de voir Hydro Québec soutenir enfin l’expansion du solaire.
Depuis le 31 mars 2026, Hydro?Québec offre une subvention à l’achat de panneaux solaires, avec un objectif de 125?000 autoproducteurs. Aujourd’hui, on en compte environ 1?000. Ce signal est déterminant pour enclencher un marché.
Parc solaire : ~1?600 $AUD/kW (~1?500 $CAD), tendant vers 1?000 $ en 2035.
Sur toiture : ~1?200 $AUD/kW (~1?100 $CAD), approchant 1000 $ en 2035.
On s’approche de 1 $/W, avant subventions. Fait surprenant : le solaire en toiture est moins cher à construire par kW, quoique la production annuelle (kWh/kW) soit meilleure pour les grands parcs solaires, mieux optimisés.
Pourquoi ces coûts en Australie??
Industrialisation mondiale des modules.
Standardisation.
Répétition.
Écosystème d’installation.
Volume.
Le solaire est modulaire : plus on en construit, plus ça devient simple et moins coûteux.
Une part importante des coûts est locale (installation, ingénierie, permis). Et ils baissent avec l’expérience.
Au Canada/Québec : ~1,6 à 3,0 $/W, le solaire en toiture étant plus cher.
Ce n’est pas structurel.
C’est un écart d’écosystème.
Une différence mal comprise
Le facteur clé est la vitesse.
Le solaire se construit en semaines ou mois pour les installations chez les clients, ou deux ou trois ans pour les parc de grande taille. Les grands ouvrages hydroélectriques prennent 10 à 15 ans.
À technologie identique, l’installation en Australie ou au Canada est comparable, même si ralentie en hiver. On invoque souvent l’ensoleillement ou le climat. Ce n’est pas l’essentiel.
La vraie différence :
L’Australie construit depuis 15 ans.
Le Québec démarre.
Le solaire n’est pas cher là où il fait moins soleil. Il est cher là où on ne le déploie pas.
Des avantages sous-estimés
Le solaire complète l’hydro : production distribuée, coûts prévisibles. Couplé aux batteries, il réduit la pression sur les turbines et les pointes, surtout que les journées froides sont généralement ensoleillées.
Hydro : risque hydrologique pluriannuel. Solaire/éolien : variabilité de court terme, stabilité relative d’une année à l’autre.
La différence clé est le profil de risque.
Un grand projet :
Immobilise du capital et du territoire pour des décennies.
Suscite souvent de l’opposition.
Est difficile à ajuster.
Le solaire :
Se déploie par incréments.
S’ajuste rapidement.
Coexiste avec d’autres usages.
Conséquence : meilleure acceptabilité et surtout plus de flexibilité.
En mi?transition, cela donne de l’optionalité.
Avec des projets petits et rapides, on peut ralentir, arrêter ou redimensionner sans coûts irrécupérables majeurs. Les erreurs coûtent moins cher. Les grands projets, eux, concentrent les risques.
Dans un contexte incertain, c’est un avantage stratégique.
Ce que cela implique
Le solaire est aussi un projet industriel : installation, ingénierie, intégration réseau, fabrication partielle. Le déploiement crée des compétences et des entreprises qui créent de la valeur ici.
Trois points :
Le solaire n’est pas expérimental. C’est déjà déployé à grande échelle.
Les coûts dépendent du volume et de l’écosystème construit avec l’expérience.
Le frein est institutionnel et organisationnel, pas technologique.
Et maintenant??
Le Québec peut rattraper rapidement, à condition de faire ce qui marche ailleurs :
Passer des pilotes à un programme soutenu et prévisible.
Simplifier et standardiser.
Apprendre en déployant.
Intégrer le solaire comme une composante normale du système.
Le point de bascule est simple : Traité comme une industrie, le solaire devient compétitif.
Hydro Québec is looking to Nova Scotia for offshore wind. At first glance, that may seem surprising. Why source electricity from more than 1,000 km away when Québec already has a major hydroelectric fleet?
Yet the real issue is not a project, but a strategic option. Hydro-Québec’s call for information is not an investment decision. It is a way to test the technological, economic, and logistical conditions for offshore supply from Nova Scotia.
The underlying question is straightforward: how can the energy system be extended beyond provincial borders?
An industry that remains limited in Québec
Offshore wind is not simply an extension of onshore wind.
It relies on a specific industrial base, historically tied to offshore oil and gas. Specialized vessels, heavy foundations, and complex marine logistics are all part of the picture. The Atlantic provinces have that industrial heritage. Québec has much less of it.
That does not mean Québec is excluded. But its role would be different.
Wind turbine towers could be manufactured here. Québec has a strong base in heavy steel fabrication and large-scale infrastructure. Some structures and foundations could also be built here. Shipyards could contribute as well, particularly to steel substructures, floating platforms, offshore electrical substations, and certain specialized vessels and barges linked to installation. Blades, however, are more constrained. They are closely tied to specific manufacturers and turbine models.
But without sufficient scale, it is difficult to build out a full value chain. Critical mass remains the key factor.
A Logic of Complementarity
From a power system perspective, the logic is fairly clear. Québec’s hydroelectric system is flexible and dispatchable. Offshore wind offers a higher capacity factor and more stable output than onshore wind. On top of that, there is a relatively low geographic correlation: wind regimes in Atlantic Canada and Québec differ, as do demand patterns.
So this is not about substitution. It is about complementarity.
The Real Constraint: Transmission
To integrate Nova Scotia offshore wind into Québec’s system, a credible transmission solution will be needed. These are long, capital-intensive, and politically sensitive projects.
This architecture would not necessarily take the form of a simple bilateral Québec—Nova Scotia link. Depending on the option selected, other provinces, especially New Brunswick, could also become essential players.
Among the conceivable options, a submarine power link could be considered. Submarine power links, which are far more developed in Europe than in Canada, are already used to connect offshore wind farms and to link electricity markets, such as between the United Kingdom and continental Europe, including Denmark.
The wind farms would come ashore in Nova Scotia, which would necessarily require close coordination with that province’s authorities and with its system operator, IESO Nova Scotia. That is not an obstacle in itself, but rather a normal institutional step.
The value of such interconnections would also lie in their bidirectional nature. They could allow hydro generation to be dispatched to supply Nova Scotia and the Maritime provinces during periods of low wind, while also allowing offshore wind imports when appropriate. That would move the system beyond occasional exchanges toward continuous regional optimization.
In the current context, such interconnections could also potentially be framed as strategic national-interest infrastructure under the Building Canada Act, which could help accelerate their treatment at the federal level.
Without transmission, none of this exists. With transmission, the scale changes.
A Strategic Shift
This initiative suggests an implicit recognition of the limits of purely local development. Not everything will be built in Québec, at the required pace and scale.
It also opens the door to an east-west logic that has often been discussed but rarely made concrete. Not as an abstract political project, but as an operational response to a real issue: rising demand and the need to diversify sources.
It can also be read as an early concrete step toward the Canadian energy corridor that people have talked about for years. Not yet as a fully articulated grand design, but as a possible first manifestation: linking provincial electricity systems more closely in order to combine resources, share flexibility, and strengthen collective resilience.
An Industrial Opportunity That Would Need to Be Structured
Québec could capture part of the value chain: towers, structures, and components. But that will not happen on its own. Without an explicit industrial strategy and interprovincial coordination, value creation will happen elsewhere.
Conclusion: A Test of A Model
Hydro-Québec’s initiative is, therefore, not an offshore wind project. It is a test of a model.
Generation in the East, flexibility in Québec, integration through transmission.
But the real test is not technological. It is institutional and political.
Is Canada still capable of building energy architectures at the scale of the country, or will it remain trapped within provincial boundaries?
Hydro Québec regarde vers la Nouvelle-Écosse pour de l’éolien en mer. À première vue, cela peut surprendre. Pourquoi aller chercher de l’électricité à plus de 1000 km, alors que le Québec dispose déjà d’un parc hydroélectrique considérable??
Pourtant, le vrai sujet n’est pas un projet, mais une option stratégique. L’appel d’information lancé par Hydro-Québec ne constitue pas une décision d’investissement. Il sert à tester les conditions technologiques, économiques et logistiques d’un approvisionnement maritime en provenance de la Nouvelle-Écosse.
La question de fond est simple : comment élargir le système énergétique au-delà des frontières provinciales??
Une industrie encore peu présente au Québec
L’éolien en mer n’est pas une simple extension de l’éolien terrestre.
Il repose sur une chaîne industrielle spécifique, historiquement liée à l’exploitation pétrolière et gazière en mer. Navires spécialisés, fondations massives, logistique lourde. Les provinces atlantiques ont cet ancrage. Le Québec beaucoup moins.
Cela ne signifie pas que le Québec est exclu. Mais son rôle est différent.
Les tours d’éoliennes peuvent être fabriquées ici. Le Québec dispose d’une base solide en mécano soudé et en grands ouvrages. Les structures et certaines fondations sont aussi envisageables. Les chantiers navals pourraient aussi contribuer, notamment pour des sous-structures en acier, des plateformes flottantes, des postes électriques en mer ou certains navires et barges spécialisés liés à l’installation. Les pales, en revanche, sont plus contraignantes. Elles dépendent étroitement des fabricants et de leurs modèles.
Mais sans volume suffisant, il est difficile de structurer une filière complète. La masse critique reste le facteur déterminant.
Une logique de complémentarité
Sur le plan du système électrique, la logique est assez claire. L’hydroélectricité québécoise est flexible et pilotable. L’éolien en mer offre un facteur de capacité plus élevé et une production plus stable que l’éolien terrestre. À cela s’ajoute une faible corrélation géographique : les régimes de vent en Atlantique et au Québec diffèrent, tout comme les profils de demande.
On ne parle donc pas de substitution, mais de complémentarité.
Le véritable verrou : le transport
Pour intégrer de l’éolien en mer néo-écossais au système québécois, il faudra une solution de transport crédible. Ce sont des projets longs, coûteux, et politiquement sensibles.
Cette architecture ne relèverait pas nécessairement d’un simple axe bilatéral Québec–Nouvelle-Écosse. Selon la solution retenue, d’autres provinces, en particulier le Nouveau-Brunswick, pourraient aussi devenir des acteurs incontournables.
Parmi les options concevables, une liaison électrique sous-marine pourrait être envisagée. Les liaisons électriques sous-marines, beaucoup plus développées en Europe qu’au Canada, sont déjà utilisées pour connecter des parcs éoliens en mer et relier différents marchés électriques, comme entre le Royaume-Uni et le continent européen, y compris le Danemark.
Les parcs éoliens atterriraient en Nouvelle-Écosse, ce qui implique nécessairement une coordination étroite avec les autorités de cette province et avec son opérateur de système, IESO Nova Scotia. Celui-ci ne constitue pas un obstacle en soi, mais bien une étape institutionnelle normale à franchir.
L’intérêt de telles interconnexions serait aussi leur caractère bidirectionnel. Elles permettraient de piloter la production hydroélectrique pour alimenter la Nouvelle-Écosse et les provinces maritimes lors des périodes de faible vent, et d’importer de l’éolien lorsque pertinent. On ne parlerait plus d’échanges ponctuels, mais d’une optimisation continue du système à l’échelle régionale.
Dans le contexte actuel, de telles interconnexions pourraient aussi être envisagées comme projets d’infrastructure stratégique d’intérêt national au sens de la Loi visant à bâtir le Canada, ce qui pourrait contribuer à accélérer leur traitement au palier fédéral.
Sans transport, rien de tout cela n’existe. Avec transport, on change d’échelle.
Un glissement stratégique
Cette initiative suggère une reconnaissance implicite des limites du développement strictement local. Tout ne pourra pas être fait au Québec, au rythme et à l’échelle requis.
Elle ouvre aussi la porte à une logique est-ouest, longtemps évoquée, mais rarement concrétisée. Non pas comme un projet politique abstrait, mais comme une réponse opérationnelle à un problème réel : la croissance de la demande et la nécessité de diversifier les sources.
On peut aussi y voir un début concret de ce corridor énergétique canadien dont on parle depuis longtemps. Pas encore comme un grand dessein pleinement articulé, mais comme une première matérialisation possible : relier davantage les systèmes électriques provinciaux de l’Est et du Centre pour mieux combiner les ressources, partager la flexibilité et renforcer la résilience collective.
Une opportunité industrielle à structurer
Le Québec peut capter une partie de la chaîne de valeur : fabrication de tours, structures, composantes. Mais cela ne se fera pas spontanément. Sans stratégie industrielle explicite et sans coordination interprovinciale, la valeur se développera ailleurs.
Conclusion : un test de modèle
L’initiative d’Hydro-Québec n’est donc pas un projet d’éolien en mer. C’est un test de modèle.
Production à l’Est, flexibilité au Québec, intégration par le transport.
Mais le vrai test n’est pas technologique. Il est institutionnel et politique.
Le Canada sait-il encore bâtir des architectures énergétiques à l’échelle du pays, ou restera-t-il prisonnier de ses frontières provinciales??