Energy debates often remain trapped in a simple logic: if demand rises, more generation capacity must be built, especially to meet peaks.
Energy efficiency and conservation efforts can, of course, slow the pace of new capacity additions. But they do not change the underlying issue: we still need to decide how to organize the system.
The implicit response to rising demand is, therefore, to build new power plants and the associated transmission infrastructure. In Québec, that typically points to new large hydropower projects.
This is precisely the logic that the hydro-solar-batteries triplet invites us to rethink. Its value lies not only in adding assets, but also in better managing, across time and space, the electricity the system can produce.
This article deliberately stays at the system level. It does not go into the different solar and battery segments, whether residential, commercial, industrial, or utility scale. Those distinctions deserve an article of their own.
(LinkedIn: https://www.linkedin.com/pulse/hydro-solar-batteries-triplet-machine-managing-time-space-marcoux-hydye)
The Pivot: Batteries Change the Equation
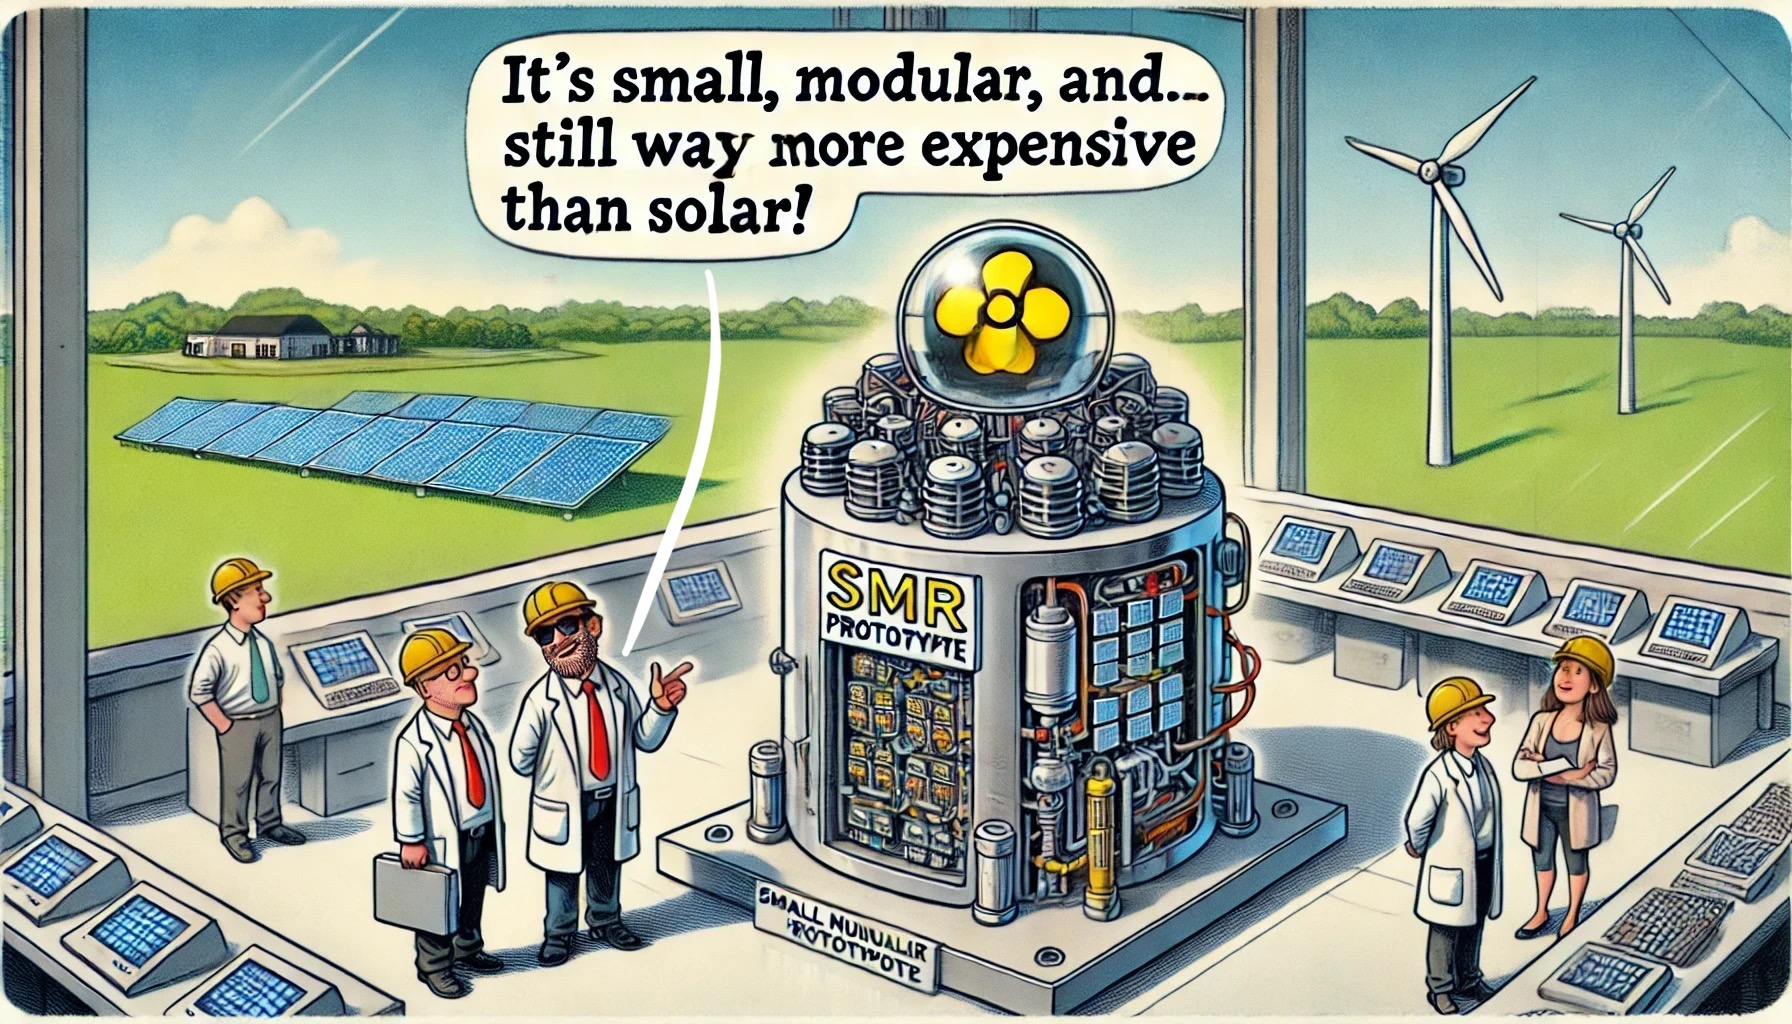
Today, for peak capacity, new hydropower peaking plants no longer appear fully competitive with batteries. At comparable power capacity, batteries offer lower costs, much shorter deployment timelines, and far greater operational flexibility.
So this is no longer just a technological complement. In some cases, batteries are becoming a credible, and often preferable, alternative to new peaking plants.
For illustration:
- Tomago (Australia): a 500 MW, 2,000 MWh battery, about A$800 million (? C$750 million), or roughly C$1.5 million per MW installed, with a delivery timeline of about two years.
- Churchill Falls Expansion (Labrador): a 1,100 MW peaking plant, with an estimated cost of C$4.6 billion including financing, or nearly C$4.2 million per MW, excluding the additional transmission line, relying on the existing reservoir, with commissioning planned for 2035.
At comparable power capacity, the gap is significant: roughly a factor of three in cost per MW, on top of radically different timelines and execution complexity.
The decisive difference, however, lies in how each asset is used. A peaking plant is dispatched for only a few dozen hours per year. A battery, by contrast, is used continuously to arbitrage across time, stabilize the grid, and manage peaks.
That versatility changes the nature of the investment: we move from a specialized asset used only marginally to a multi-purpose asset that is called upon continuously.
Moving Energy Through Time… And Space
In practical terms, the system can work differently.
Outside peak periods, electricity is produced in the north from hydropower, or in the south from solar and wind. That energy is then transported and stored in batteries, particularly near load centres.
During peak periods, that energy is discharged locally.
This mechanism reduces stress on the grid, lowers dependence on peak-oriented infrastructure, and makes better use of existing assets.
It also makes it possible to absorb occasional excess generation, for example, when spring freshets, strong wind output, and strong solar output on mild days occur at the same time. In that case, the energy is stored and redistributed later, when it can be consumed.
A Systemic Effect: Once Installed, Batteries Change Everything
A battery installed for the winter peak does not serve only in cold weather.
It becomes a central system asset:
- It smooths solar output on a daily basis.
- It enables arbitrage between off-peak and peak hours.
- It supports grid frequency and stability.
- It reduces cycling and wear on turbine-generator sets.
Above all, it makes it possible to reserve hydropower for what it does best: seasonal storage and long-duration management.
That potential, however, can only be fully realized if the whole system is operated in an integrated way. Forecasting hydro inflows, solar and wind output, anticipating demand, coordinating generation, and managing battery charging and discharging cycles: the triplet raises the system’s optimization requirements. This raises the value of more advanced tools, and also opens up relevant uses for artificial intelligence.
Solar: Low-Cost Fuel for the System
Solar plays a key role in the triplet proposed for Québec.
Its strength is twofold: it can be deployed quickly, and it provides low-cost energy. In Australia, installed solar costs have now fallen to levels low enough to change the economics of the power system. Expressed in power terms, they are on the order of C$1.1 to C$1.5 million per MW, while providing additional energy at very low cost.
These costs also reflect a development, installation, and interconnection ecosystem that is now highly mature in Australia. They therefore do not automatically translate to Québec, where solar is still at an early stage. But they do show what becomes achievable as the sector matures.
It is also worth noting that Hydro-Québec has recently taken an important step in this direction, by launching financial support for the purchase of solar panels and setting a target of 125,000 self-generating customers by 2035.
In this architecture, solar produces mostly in summer and, of course, during the day. That energy can be used immediately, shifted within the day thanks to batteries, or indirectly carried forward to winter by reducing hydropower output and allowing more water to be stored in reservoirs.
Solar is, therefore, not just an additional source of generation. It is a low-cost resource whose value can be shifted within the system. It reduces the immediate use of hydropower and increases the value of storing electricity in batteries.
An Illuminating Economic Comparison
This complementarity is also reflected in broad economic orders of magnitude.
We can push the reasoning a bit further with the proposed Gull Island hydro generating station in Labrador. The project targets 2,250 MW, about 12 TWh of dispatchable annual generation, and an estimated cost of C$24.9 billion.
Using, for illustration, a battery cost of about C$1.5 million per MW, an equivalent 2,250 MW of battery capacity would represent about C$3.4 billion. This comparison with battery costs remains imperfect: it captures well the value of daily modulation, but not the full sustained support capability that hydropower plants can provide over several days. Even so, if we attribute that portion of Gull Island’s cost to its power and dispatch function, more than C$21 billion remains to be explained for the energy function. That is a large amount for 12 TWh.
Using reasonable working assumptions inspired by costs observed in Australia, an annual volume of solar energy equivalent to 12 TWh could be deployed for about C$11 to C$14 billion, which would correspond to roughly 9,100 MW installed, based on an approximately 15% capacity factor that can be expected in Québec. About half the cost of Gull Island.
This exercise is not a perfect equivalence. 9,100 MW of solar capacity would be a very large build-out. Gull Island also provides dispatchable output and winter value that solar alone cannot provide. But it highlights an important point: once the flexibility function is isolated, even approximately, the “energy” component of a large hydropower project such as Gull Island appears more expensive than a solar alternative producing the same annual volume.
Hydropower: from Flexible Assets to Strategic Reserve
In this context, the role of hydropower evolves.
It remains essential, but its use becomes more strategic.
Rather than being called on continuously for short-term flexibility, it can be increasingly reserved for:
- Seasonal management.
- Prolonged periods of low solar or wind output.
- System security.
This reduces the mechanical stress associated with frequent cycling and maximizes the value of an asset that already exists.
And Wind?
Wind fits naturally into this logic.
Its output, often higher in winter, is particularly useful in Québec’s context. But, like solar, it increases the value of storing electricity in batteries and of flexibility.
It does not compete with the triplet. It strengthens it. Perhaps we should speak of a quadruplet.
A Different Economic Logic
From an economic and energy planning perspective, the triplet changes the nature of investment.
It makes it possible to substitute some heavy, slow-to-deploy, and lightly used infrastructure with modular, rapidly installed, multi-purpose assets.
It also improves system management and the pacing of investment. Because solar and batteries can be deployed in stages, it becomes easier to slow down or accelerate depending on actual demand growth, cost trends, grid constraints, or energy-efficiency gains.
It also strengthens Hydro-Québec’s arbitrage capacity in neighbouring electricity markets, whose model already relies in part on exporting during peak periods and importing off-peak, in addition to long-term contracts.
Conclusion: a Machine for Travelling Through Time
At heart, the hydro-solar-batteries triplet turns the electricity system into a time travel machine.
It makes it possible to decide when to produce, when to store electricity in batteries, and when to use it.
In a context of uncertainty, growing demand, and deployment constraints, that capability becomes more valuable than the simple addition of capacity.
The issue is, therefore, no longer just producing more. It is better exploiting, across time and space, the electricity we are capable of producing, and extracting more value from it.
References
Churchill Falls
https://www.ourchapter.ca/fact-sheet
https://www.hydroquebec.com/a/info-labrador
https://www.ourchapter.ca/files/NewfoundlandLabrador-Quebec-MOU-Briefing-Deck-Dec-12-2024.pdf
Australia
https://www.csiro.au/en/research/technology-space/energy/Electricity-transition/GenCost