Category Archives: Policies and Regulatory

Energy Is Cheap; Power Is Valuable

For a while now, I have been saying that we are entering a world where energy (kWh) is cheap, thanks to dropping solar and wind costs, but power (kW) is expensive, needed as it is to balance renewables and peaking new uses, such as electric vehicle charging.[i]

There are not a lot of empirical evidence of this phenomenon, but Ontario offers one. 

In 2005, Ontario decided to move to a “hybrid” deregulated generation market, with a “Global Adjustment” (GA) charge on customer electricity bill that is used to cover the difference between the energy market price (¢/kWh) and rates paid to regulated and contracted generators for providing capacity (kW). The energy market price was intended to reflect the marginal cost of production, with contracts meant to compensate fixed capacity costs. Over time, as contract volumes increased, more and more of the costs of generation became charged through capacity contracting rather than through energy market revenues. In addition, a significant number of zero marginal cost bidders (essentially renewables) were built, further depressing market revenues. As the chart below indicates, a growing portion of generator payments shifted from the energy market onto capacity contracts, which were then charged to customers through the Global Adjustment.[ii]

This is for Ontario, with its peculiar market structure. However, with the advent of renewables and increasing electrification of the economy, we will see the same trend across the world: the capacity-driven cost of the grid will be exposed. The underlying trend is:

Energy, in kWh or MWh, will get very cheap.

Power, in kW or MW, will be very valuable.

For stakeholders in the industry, it means that economic value will be created with services and tools that help manage power, such as shifting peaks. If you own a generation source with non-zero marginal costs and cannot play on a capacity market, you’re in trouble. 

If you think that this is sort of crazy, think about what happened in the telecom market over the last couple of decades. It used to be that local phone connections were relatively cheap, but long-distance phone calls were extremely expensive (dollars per minute for some international calls). Nowadays, long-distance calls are effectively free, thanks to Skype and FaceTime, with video as a bonus. However, Internet access is expensive. 

How will this affect your business?


[i]  See my 2018 posts, https://benoit.marcoux.ca/blog/cea-tigers-den-workshop/and https://benoit.marcoux.ca/blog/a-perspective-on-canadas-electricity-industry-in-2030/.

[ii]  Data for this chart was extracted from http://www.ieso.ca/en/Corporate-IESO/Media/Year-End-Data. Contact me is you want the underlying numbers. 

How Bill 34 Will Affect Vendors Selling to Hydro-Québec

The Government of Québec has tabled Bill 34[1]that simplify the rate-setting process for Hydro-Québec Distribution.[2]Essentially, most distribution rates are frozen for 2020, and then adjusted for inflation until 2025, when a rate review would occur. Additionally, the bill requires Hydro-Québec to reimburse to customers of some $500 million before 1 April 2020.[3]It should be noted that Hydro-Québec currently has the lowest residential rates in North America.[4]

This Bill is a significant change from the traditional rate base rate-of-return regulation that previously subjected Hydro-Québec to yearly rate filing. Based on my personal marketing experience in the electricity industry, this post outlines my views of how Bill 34 may change some of Hydro-Québec business drivers when dealing with its vendors, presumably leading Hydro-Québec to faster decision-making in purchasing, smarter assessment of costs, and a greater appetite for innovative solutions.

Before: Traditional Rate Base Rate-of-Return Regulation

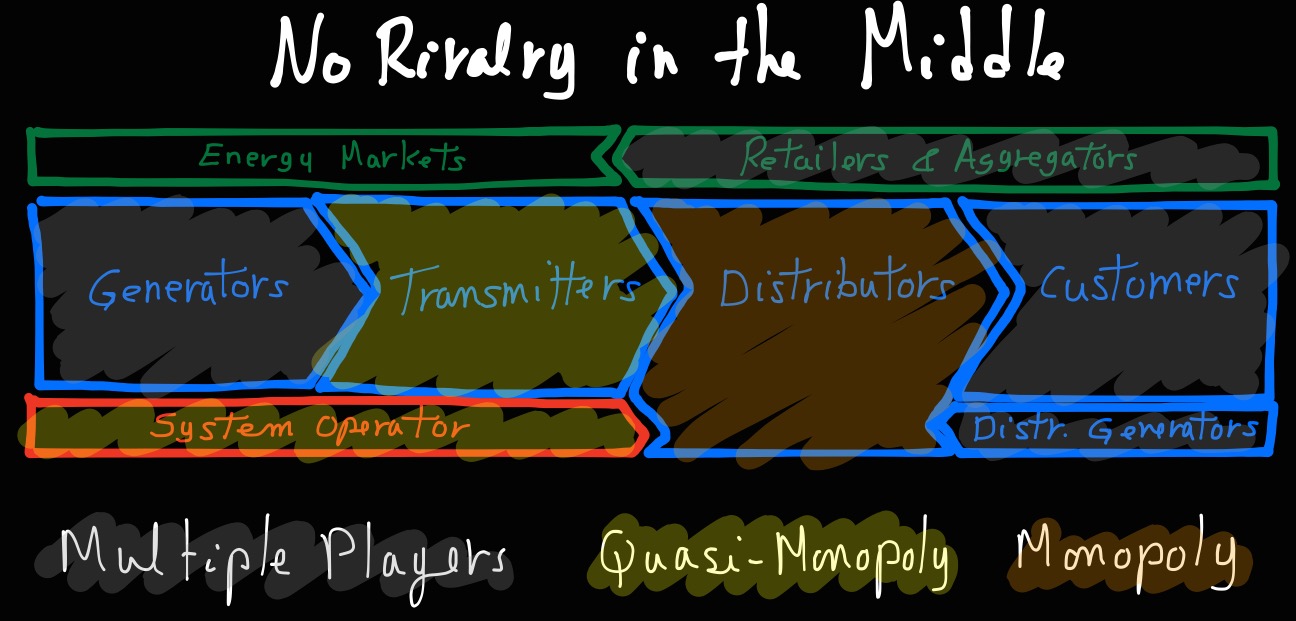
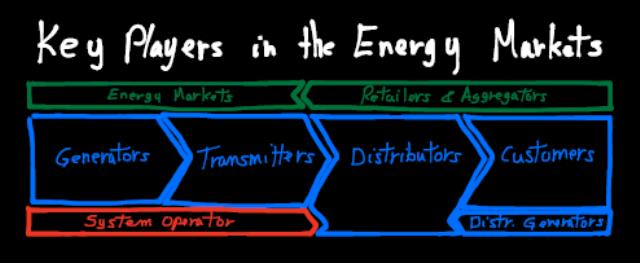
The electricity distribution business is a natural monopoly. This means that it is in the interest of society to have just one distribution utility in a given territory. It is easy to understand the rationale: you would not want to have multiple sets of poles along roads; one set is more than enough. However, left to itself, a distribution utility with a monopoly could charge unreasonable rates for use of its bottleneck facility.[5]

In most of Canada and the United States, electric utilities are regulated using a traditional rate base rate-of-return regulation regime. Under this regime, the sum of all regulated costs – essentially operating expenses, depreciation on assets (resulting from past capital expenditures), interests on debt, taxes, as well as an allowed shareholder returns on investments (i.e. a reasonable profit) – are recovered from customers. This is called revenue requirement or required revenues. Required revenues are allocated across the customer base in a variety of ways, primarily on the basis of the energy distributed (cents per kilowatt-hour, ¢/kWh), as well as peak load (dollars per kilowatt, $/kW) for some commercial and industrial customers. In practice, different classes of customers get different rates, but revenues projected during a regulatory rate case have to be equal to revenue requirements. If there is a significant variance between the projected revenues and the actual revenues in a year, adjustments are normally made in subsequent years.[6]

Obviously, regulated utilities are not allowed to spend anyway they want: they have to prove to their provincial regulator – the Régie de l’énergie in Québec, the Alberta Energy Board, the Ontario Energy Board, etc. – that their costs (both operating expenses and capital expenditures) are necessary and prudent. These arguments are aired during public rate cases – yearly in the case of Hydro-Québec, up to now – during which various interveners, typically representing customer groups, submits reports and ask questions. The process can be slow, adversarial and excruciating as all details of operations are looked at and need to be justified – the regulator often does not trust the utility and even activities and investments that a utility may present as essential may not be approved. 

Rate-of-return regulation of utility monopolies has served relatively well as a market substitute for a century, but it has its drawbacks. I’ll retain three issues for discussion here: slow innovation, poor service quality, and uneconomic decisions.

Innovation tends to be among the casualties of rate-of-return regulations: the slow regulatory cycle, the public scrutiny and the second-guessing by interveners makes utilities extremely risk-averse and slow to integrate new technologies. For example, as part of rate cases, utilities sometimes specify models of power equipment, which become the standard products used in the network. Because another complex homologation process would get in the way, product selection may not be revised for many years, even decades, often until the vendor cease production. However, over time, utilities often end up customizing those products, based on experience or new needs, rather than seeking newer products. 

Rate-of-return regulation is an economic form of regulation that does not properly account for service quality. It is difficult to integrate service quality metrics in this regulatory framework and offering varying levels of service quality depending on willingness to pay is not practical. Not surprisingly, electric utilities tend to have negative Net Promoter Scores (NPS), a loyalty measure, with generally far more detractors than promoters among customers.[7]

Since their revenues are practically known in advance following rate setting, regulated utilities look at their business upside-down in comparison to companies operating in a competitive, free market:

  • Shareholders earn a return on all utility assets – the more, the better. New investments mean a larger asset base, on which the shareholders are allowed to claim a return, meaning that net income will also be higher. There is a strong incentive for utilities to buy more equipment or to gold-plate it, although interveners may oppose, and regulators may not agree. 
  • Regulated utilities effectively pass operating expenses to their customers. Indeed, lowering (or increasing) operating expenses simply lowers (or increases) required revenues, but net income remains unaffected. Yet, the regulatory process tends to compress controllable operating expenses (like customer service or maintenance) in expectation of raising efficiency by the utility. Utilities may actually go along, shareholders preferring to compress operating expenses than investments in assets. 

For vendors, traditional rate base rate-of-return regulations mean that making normal sales arguments often does not make sense in a utility world: 

What vendors may sayWhat utility people may think
“You would be the first in the industry to implement this new technology.”“…And go through hell trying to get it approved.”
“You’ll save on capital expenditures with this new equipment.”“Why would we do this? Shareholders want to justify more capital expenditures, not less.”
“You’ll be making more profit by adopting my cost-saving solution.”“No, we’ll have to pass on the savings to customers at the next rate case and not make more profit.”

Surprisingly, it seems that few vendors understand this traditional utility buying logic, although it is very much the normal case across Canada and the United States. However, Bill 34 is changing all this in Québec.

What Is Bill 34 Changing?

Bill 34 freezes most distribution rates for 2020, followed by yearly adjustments for inflation until 2025, when a rate review would occur. Therefore, Hydro-Québec would no longer have to file rate applications, with detailed costs justifications, every year. Under the Bill, Hydro-Québec is not required to obtain authorization for its infrastructure investment projects and changes to the electricity distribution network. Similarly, commercial programs do not need approval. In contrast to traditional regulation, Bill 34 effectively disconnects costs and revenues for 5 years and should introduce more common business decision-making. 

Bill 34 also stops the Régie efforts to move to a Performance-Based Regulation (PBR). PBR is increasingly popular to regulate utilities[8]. In Canada, Alberta has adopted PBR.[9]Another good example is Great Britain, with its RIIO (Revenue = Incentives + Innovation + Outputs) framework.[10]PBR generally aims to balance multiple variables, such as quality of service and costs, while freeing utilities to innovate. Without presuming of the rationale behind Bill 34, it may be that the very low costs of electricity in Québec in comparison to the jurisdictions where PBR was implemented, as well as Hydro-Québec’s renewable generation fleet, present a simpler approach toward the same objectives. 

After: Faster, Risk-Taking and Innovative?

Hydro-Québec remains a natural monopoly, without direct competitive pressure. However, with Bill 34, decision-making should become much closer to that of “ordinary” commercial business, with a new-found flexibility and a greater drive toward efficiency and business innovations. Hydro-Québec will be incentivized to reduce costs to increase net income, as revenues will be stable (after inflation). In particular, the new framework removes the bias toward capital expenditures and rewards a smarter control of operating expenses. For instance, with greater flexibility, Hydro-Québec might increase maintenance and extend life of some power equipment at the same time that it might replace other assets with advanced systems – all in the name of efficiency.

All this may change how Hydro-Québec will interact with equipment and service vendors, although any change to purchasing decision-making will undoubtedly depend on management decisions and may be slowed by the natural inertia of the company. 

Nevertheless, Hydro-Québec may become more open to acquire new products and services from new vendors, with a corresponding risk for established vendors. High-end or customized (and therefore more expensive) products from established vendors may be especially at risk of substitution by less expensive or industry-standard ones. In some cases, the number of vendors supplying a type of product dwindled to just one over the years; it now may be that Hydro-Québec will seek to split contracts with a competitor to try to bring down costs on commodity products. On the other end, like common in other industries, Hydro-Québec may also seek broad strategic partnerships for more complex products, with favorable contract terms for Hydro-Québec in exchange for a vendor exclusivity in some product categories. 

With the greater flexibility brought by Bill 34, Hydro-Québec may also become more inclined to try out innovative products or systems in its distribution network, and we could see faster decisions to deploy those innovations. This might come at an opportune time, as other utilities introduced new grid technologies in order to support distributed generation (especially solar) at a very large scale[11]; Hydro-Québec could learn from the vendors involved in these deployments.

Similarly, Bill 34 might enable Hydro-Québec to accelerate the launch of new products or services to its customers, possibly in collaboration with external vendors. Hydro-Québec has been innovative in researching new uses for electricity and energy efficiency system, going as far as building houses to test smart home technologies.[12]Hydro-Québec publicly expressed interest in how smart home, solar generation, energy storage and microgrids could impact its network.[13]Other utilities have already introduced services and products to their customers around these concepts, like BC Hydro (CaSA smart thermostats)[14], Green Mountain Power (Tesla batteries and FLO smart electric vehicle chargers)[15], Hydro Ottawa (Google smart assistant),[16]and many more; it would not be surprising to see Hydro-Québec following suit. 

What May Not Change

While Bill 34 will change many things, some important practices should remain. For example, Hydro-Québec is extremely serious about cybersecurity[17]; vendors should still expect to have to meet stringent cybersecurity requirements, for good reasons. As a Québec crown corporation, Hydro-Québec also remains subjected to normal government buying policies, like requiring bids beyond certain amounts and strict rules when dealing with vendors[18]– this too will remain. 

Contrary to performance-based regulatory regimes like RIIO in Great Britain (see above), Bill 34 does not provide explicit incentives to improve the reliability of the electricity service. While this is not a change from the current regulatory regime, it should be noted that the reliability of Hydro-Québec electricity services has been degrading over the last years.[19]However, repairing the network after an outage does cost money, and some vendors could highlight how their solution prevent outages or reduce the cost of repairs. Furthermore, Hydro-Québec management could conclude that maintaining sufficient reliability is essential to avoid a decision to return to traditional regulation in 2025. 

Also, Bill 34 specifically maintains Hydro-Québec’s obligation to file an annual report. Those reports include a wealth of information on the organization, the performance and the financial situation of Hydro-Québec.[20]

Finally, utilities, including Hydro-Québec, publish public performance indicators.[21]Usually, those indicators are also used in management incentive plans. Showing the impact of a solution on performance indicators will remain a sound sales tactics when selling to utilities. 

Closing Words

Once Québec’s national assembly adopts Bill 34, probably in the Fall, it will certainly become an experiment that will be carefully watched by Canadian regulators. Leveraging the low costs of renewable electricity in Québec, it may encourage greater efficiency and business performance by Hydro-Québec, without the complexity of a performance-based regulatory regimes. 

For vendors, the Bill may also fundamentally change how Hydro-Québec should be approached, with potentially a much greater attention to total costs and partnerships than before. 

Do not hesitate to contact me to discuss further. 

Benoit Marcoux, benoit@marcoux.ca, +1 514-953-7469.


[1]               See “An Act to simplify the process for establishing electricity distribution rates”,  http://www.assnat.qc.ca/en/travaux-parlementaires/assemblee-nationale/42-1/journal-debats/20190612so/projet-loi-presentes.html, accessed 20190614.

[2]               Bill 34 only affects the distribution division of Hydro-Québec. The transmission (TransÉnergie) and generation (Production) divisions are not affected. 

[3]               See http://news.hydroquebec.com/en/press-releases/1510/electricity-rates-adoption-of-a-simplified-approach-that-will-guarantee-low-rates/, accessed 20190620. 

[4]               See http://www.hydroquebec.com/residential/customer-space/rates/comparison-electricity-prices.html, accessed 20190615.

[5]               Note that the natural monopoly does not extend to energy retail and generation. In many jurisdictions, notably in most of Alberta, Texas and Europe, there are many energy retailers buying electricity from generators and offering various plans to customers. However, this energy is supplied through electricity distributors that have the poles and conductors up to customers’ homes. In Canada, provinces other than Alberta and Ontario have only vertically integrated distributors and retailers, i.e., the distributor is also the only retailer of electricity. 

[6]               To some extent, Bill 34 is the result of lack of adjustments from over-earning in previous years, as the provincial government, owners of Hydro-Québec, kept these surpluses. This resulted in a delicate political situation, as many people saw this as a disguised tax.

[7]               See CEA Opinion Research, 2014 National Public Attitudes for NPS of Canadian utilities, and https://en.m.wikipedia.org/wiki/Net_Promoter, accessed 20190615, for an overview of the concept. 

[8]               See http://go.woodmac.com/webmail/131501/471713673/8ec22b38df7f81ef4f8278af14095e1bb711214dffd0ee90dc9a250ab8bb5970, accessed 20290619, for an overview of PBR adoption in the United States.

[9]               See http://www.auc.ab.ca/pages/distribution-rates.aspx, accessed 20190615.

[10]             See https://www.ofgem.gov.uk/network-regulation-riio-model, accessed 20190615.

[11]             For example, there are 840,878 residential solar projects in California (https://www.californiadgstats.ca.gov/charts/, accessed 20190617) but only about 700 in Québec (see https://www.lapresse.ca/affaires/economie/energie-et-ressources/201903/22/01-5219334-mini-boom-de-production-denergie-solaire-au-quebec.php, in French, accessed 20190617). Integrating a large number of distributed generators in a distribution network is challenging, and utilities in some other jurisdictions had to innovate to make it work.

[12]             See https://ici.radio-canada.ca/nouvelle/1016006/hydro-quebec-maisons-futur-shawinigan-energie-solaire-thermostats(in French), accessed 20190617.

[13]             See http://plus.lapresse.ca/screens/f2ad982b-9fda-469f-a3f2-86116ab0a46a__7C___0.html(in French), accessed 20190617.

[14]             See https://www.bchydro.com/powersmart/energy-management-trials/casa-thermostat-trial.html, accessed 20190617. 

[15]             See https://greenmountainpower.com/products-all/, accessed 20190617.

[16]             See https://hydroottawa.com/save-energy/innovation/smart-audio, accessed 20190617. 

[17]             For example, Hydro-Québec is funding an industrial research chair in smart grid security at Concordia University – see  http://www.nserc-crsng.gc.ca/Chairholders-TitulairesDeChaire/Chairholder-Titulaire_eng.asp?pid=981, accessed 20190617.

[18]             See https://www.hydroquebec.com/suppliers/becoming-supplier/safe-ethical-and-responsible-procurement.html, accessed 20190618.

[19]             The average number of minutes of outages per Hydro-Québec customer, excluding major events like storms, has been steadily increasing, from 126 minutes in 2013 to 181 in 2018. See http://www.regie-energie.qc.ca/audiences/RappHQD2013/HQD-09-02-Indicateursdeperformance.pdfand http://publicsde.regie-energie.qc.ca/projets/501/DocPrj/R-9001-2018-B-0060-RapAnnuel-Piece-2019_04_18.pdf, respectively for 2013 and 2018, in French, accessed 20190617. 

[20]             See http://www.regie-energie.qc.ca/audiences/RapportsAnnuels_DistribTransp.html, accessed 20190615, for past annual reports in French.  

[21]             See http://publicsde.regie-energie.qc.ca/projets/501/DocPrj/R-9001-2018-B-0060-RapAnnuel-Piece-2019_04_18.pdffor Hydro-Québec’s 2018 performance indicators, in French, accessed 20190618. 

A Trojan Horse: Time-Varying Rates

A majority of Canadian households and small businesses are in provinces where time-varying rates or peak pricing or rebates are available or proposed, thanks to smart meters installed over the last few years. Tariffs for large business already include a demand charge that makes up a big chunk of their bills, inciting them to have a constant power draw. Many businesses also have critical peak pricing or rebates. Therefore, most of the electricity in Canada is sold to people having financial incentives to not only be energy efficient (i.e., consume fewer kWh overall), but to manage when electric power is drawn from their utility. However, with the possible exception of large electricity users, most customers simply do not want (or can’t) manage the minutia of consuming electricity on an hourly or daily basis. This is to be expected, as it’s a lot of work and inconvenience for little pay: running the dishwater off-peak rather than on-peak may save a dime, but it means noise when people are trying to sleep and emptying it during the morning rush to school or work. Although all the saved dimes may add up to significant dollars at the end of a year, human nature makes us lazy, and we just go on whining about high hydro cost instead.

In aggregate, everybody’s dimes also add up to a lot of money for the society. For most people and businesses, electricity is not something to get passionate about. It is a significant – but not the largest – component in the budget. We mostly notice electricity when it is not there, as we can’t do much without it. Most people don’t know or care how electricity get to them, as long as they can benefit from it and that its rates appear to be fair. The significant yet stealthy nature of electricity makes it the perfect commodity. Electrons have no brand, no color, no flavor. It becomes easy to rationalize outsourcing the management of electricity to a third party if it reduces cost and make our lifes easier.

Time-varying rates and peak pricing or rebates thus create the financial incentives for new energy services to emerge and help individual customers save money – they are a Trojan horse inside the utility castle. Essentially, energy service companies are introducing themselves in the value chain – it’s a form of value-added intermediation, although energy service companies are not allowed to resell in most provinces. In addition to rate arbitrage, the business model of energy service companies leverages the dropping cost of rooftop solar power and energy storage, supported by mass-market smart home devices (for residences) or off-the-shelf building management systems (for businesses) connected over the Internet. Lower electricity costs with cool gadgets and better comfort. Voilà! A competitor is born.

Energy service companies are offering what amounts to a partial substitute for electric utility services. Rooftop solar panels, batteries, smart home thermostats, water heaters and lighting, building management systems, EV chargers, thermal storage and other technologies marketed by energy services companies, engineering firms and solar developersdo not replace mains electricity. However, energy service companies provide financing and remove the complexity of managing electricity rates and provide other benefits such as comfort or backup during outages. In the process, energy service companies capture a decent chunk of the electricity value stream as they turn electricity service into even more of a commodity service. Less energy (kWh) gets delivered by utilities, pushing rates up for all, although few customers will actually go off the grid.

Storms on the horizon. Ouch. That’s competition, and it is new for many in electricity utilities.

Energy service companies are not directly competing with utilities – not like, say, Bell or Telus competing with Rogers or Vidéotron – but it is competition nevertheless – a bit like Bell being in a strange love-hate relationship with Google. In fact, customers must buy still their electricity from their local utility in most provinces[i]. If energy service companies are not direct competition, it has almost the same effect: skimming profitable segments.

Canadian generation, transmission and distribution utilities are affected at different levels and in varying ways, depending on provincial regulations and on their position along the electricity value chain.

One issue is that the tariffs structure for electricity generators and for T&D networks poorly reflects the underlying system cost structure. If rates along the electricity value chain were perfectly set, then utilities should not care if customers shift their energy consumption – after all, that’s the objective of time-varying rates and demand charges. In practice, rates are far from perfectly matching costs. For example, demand charges for small business accounts are typically set for a year or two based on the peak power demand (in kVA) in a past month. This rate structure is essentially a leftover from electromechanical meters where a meter reader would come to a business every month to read energy (kWh) and power (kVA), and then reset the power register on the meter with an actual physical key – the power register would ratchet up until the next read, when they would be reset again. That’s as good as it could be with electromechanical meters, but the maximum demand that was registered didn’t likely coincide with the peak demand on the system. The resultant tariffs structure incites business customers to minimize monthly maximum demand (and, hence, demand charges), but still allow them to draw a lot of power during a system peak, although energy management systems could have reduced demand during the peak and shift it to a different time. Working on behalf of their customers, energy service companies may end up optimizing customer demand around prevailing tariffs to minimize customer charges but may increase overall system costs in the process.

Upstream in the value chain, traditional generators and independent power producers are affected by energy efficiency and demand management initiatives that can potentially reduce energy and power demand of customers. The effects vary depending on the market structure in each province. Contracted generators are less exposed; in Ontario, the “global adjustment” mechanism compensates large generators, while Alberta has a capacity market. However, spot generators may face large variations in prices. Overall, generators are at risk of having stranded assets as energy efficiency improves in the economy and as customers contract with energy service providers to better manage power demand.

Many distribution-only utilities in Canada are partially shielded[ii]. They charge their customers a energy and power rates set by the province and a separate distribution charge that is intended to pay for the costs of their stations and network. The energy and power generation charges are pass-through, and transmitters and generators bear any issues. The distribution charge is often allocated on a per-kWh basis, plus a fixed monthly charge. Because of the per-kWh allocation of their costs, local distributors are somewhat exposed to the vagaries of energy service companies. However, the distributors have more operating costs and lower capital costs than transmitters and generators, meaning that a per-kWh distribution charge is not as far off the mark.

Mid-size municipal utilities also face a different reality than large integrated provincial utilities. Owned by the city, they are accountable local actors, close to their customers (or constituents), using their agility to respond to issues in a way that is just not happening with large integrated utilities. Municipal utilities become instruments of the local mayor and city council, like water, sewers, snow removal and other municipal services. Mayors’ challenges are about their constituents getting sick, having clean water, being warm or cool, holding productive jobs, commuting efficiently, surviving disasters. They see that the local utility supports the needs of a smart city, to be both resilient to face increasing disasters and be sustainable to reduce its environmental impact and to improve quality of life – while being financially affordable. In this context, working with third parties, like energy service companies, just becomes another means to satisfy the needs of citizens and local businesses[iii].

Large vertically integrated provincial utilities face more complex challenges than municipal utilities: the impact of energy service companies on generation can be significant, the feedback loop from constituents to the government and the utility is more tenuous, the customer base has more varied needs, and the integrated utility has a large impact on the finances of the province. Not surprisingly, they tend to prefer to maintain a greater control over the relationship with customers. Whether they can maintain control and reduce choice without antagonizing customers is uncertain, especially when consumers get used to energy service alternatives ranging from large telecom companies to Google and Amazon.


[i]       The exceptions are Alberta, the most deregulated market in Canada, and Ontario, although wholesale and retail rates in Ontario are such that about95% of Ontarians choose to buy electricity from their local utility. See https://business.directenergy.com/what-is-deregulation#deregmarketand https://www.oeb.ca/about-us/mission-and-mandate/ontarios-energy-sector, retrieved 20181023.

[ii]      However, municipal utilities in Québec pay large business rates, with demand charges.

[iii]     And, perhaps, in the process, help the mayor get re-elected.

A Perspective on Canada’s Electricity Industry in 2030

I wrote this piece with my friend Denis Chartrand as a companion document for my CEA presentation back in February 2018 (See https://benoit.marcoux.ca/blog/cea-tigers-den-workshop/) but I now realize that I never published it. So, here it is!

Canada Electricity Industry 2030 20180221

Customers of Electric Utilities Are Redefining Quality

Traditional utility wisdom in Canada is that customers are satisfied with the current level of reliability and that improving reliability would only increase costs and push rates up.

The new reality of electric utilities upends this traditional wisdom.

Customers are redefining what is meant by quality. Traditionally, Canadian Utilities used duration of interruptions per year, or SAIDI[i], as their main measure of reliability. Some utilities report the frequency of interruptions per year, SAIFI, as well. A limitation of SAIDI and SAIFI is that interruptions of less than a minute are not included, presumably under the assumption that customers do not care that much about short interruptions. This might have been true in the analog world of years past, but it is not anymore, with even a short interruption resetting our electronic devices. Furthermore, with the fuse saving protection strategy that most Canadian Utilities have adopted on their distribution feeders, short interruptions happen more frequently than longer ones, and are therefore noticed more.

Even a short interruption resets common electronics, like my microwave oven above. This gave birth to the “blinking clock” syndrome, a stark reminder to residential customers that an outage occurred and that their utility has failed them – again. (Photo by the author)

ENMAX, when justifying its distribution automation projects within the performance-based regulation scheme of Alberta, based its analysis on the cost of sustained and momentary service interruptions, with the values for its various customer classes as shown in the table below.[ii]

Table: Estimated ENMAX Customer Class Interruption Costs

Duration Residential Commercial Industrial Weighted Average
30 Minutes


$3.02 $992 $3,641 $92.77
Momentary
(% vs. 30-Min.)
$2.71 (90%) $757 (76%) $2,354(65%) $69.12(75%)
Customer mix 92.2% 7.3% 0.5% 100%

The table is interesting for two reasons:

  • On average, the costs to customers of a momentary interruption is 75% that of the cost of a 30-minute interruption, but up to 90% for residential customers. The very small difference in cost between a momentary outage and a 30-minute outage explains why outage frequency is a higher concern than length of outages for residential customers.[iii]Due to the prevalence of the fuse saving protection strategy on electrical distribution feeders in Canada,[iv]there are far more momentary service interruptions than sustained ones – momentary interruptions therefore become the primary concern of customers.
  • The bulk of the economic cost of service interruptions is borne by commercial and industrial customers. While residential customers are far more numerous, the cost per interruption is low. However, residential customers can be more vocal in their complaints in social and traditional media.

This situation is likely to get worse with widespread customer-owned distributed energy resources: owners of distributed energy resources actually lose money during power disturbance. Distributed generators or resources may be thrown offline often for minutes, for safety reasons and to protect the equipment. This results in loss revenue for owners of distributed generators selling back to the grid, or additional costs for those who were offsetting power otherwise purchased from the grid. Overall, the percentage of time when distributed generators are offline because of service interruptions is relatively small, and so is the unsold energy or the energy additionally bought by the customers while waiting for generation to come back online. However, those interruptions may also cause power generation or grid support contracts to be broken, which may carry penalties. Customers may also have to pay additional demand charges, often a large share of the utility costs of business customers.

Service interruptions also cost money, to utilities which is ultimately paid for by customers through higher rates – another key determinant of customer un-satisfaction. First, service interruptions cause power flow and voltage fluctuations as distributed generators trip and come back, and loss of generation and dynamic resources for the grid operator. In an electric network relying partly on distributed energy resources, service interruptions mean additional complexity to maintain stability of the grid and higher costs for network operators who then have to rely on backup resources. Service interruptions even increase operating costs. Fuse saving does not always work: on average, about half of fuse replacements have unknown causes or causes that should normally have been eliminated by fuse saving, such as animal contact.

By the way, the telecom industry also went through a redefinition of what customers mean by quality. It used to be that the main quality measure was voice sound quality during a call[v]. However, voice sound quality has actually gone down in the last decades – the rotary black phone in your grandmother’s old house sounded better than your new iPhone. Nowadays, customer satisfaction is driven more by the convenience of mobility and the possibility of easily doing videoconferencing or multiple parties calls.

In summary, with increasing dependence on reliable power for modern way of life, plus distributed generation earning revenue for customers, outage frequency will become a more and more important factor for customer satisfaction. All this being said, there is hope – new smart grid approaches and protection strategies can result in fewer service interruptions, leading to higher customer satisfaction and lower cost for utilities.


[i]       SAIDI means System Average Interruption Duration Index. SAIDI is the average duration of all the outages seen by customers over the course of a year. In Canada, only interruption durations of more than 1 minutes accrue to SAIDI. Interruptions of less than a minute are considered momentary and do not count toward SAIDI.

[ii]       Evaluation of PowerMax Distribution Automation Strategy, ENMAX Power Corporation, prepared by Quanta Technology, November 29, 2011, page 23.

[iii]     Assessing Residential Customer Satisfaction for Large Electric Utilities, Lea Kosnik et al., Department of Economics, University of Missouri—St. Louis, May 2014.

[iv]      Fuse saving is an electrical protection strategy used on many distribution feeders in Canada. The objective is to avoid that fuses installed on lateral taps blow for a non-persistent fault, such as an animal contact or a lightning strike. With fuse saving, a mainline or station a circuit breaker or recloser is used to operate faster than the lateral tap fuses. A few seconds after an initial fault, the breaker reclose, re-establishing power. If the fault is non-persistent, power will be restored. If not, it may retry later. If the fault is persistent, the breaker will eventually reclose and let the lateral fuse blow, isolating the fault. Because most faults are non-persistent, fuse saving prevents needless fuse blow, avoiding sustained service interruption for customers on the affected lateral. The main disadvantage of fuse saving is that all customers on the circuit see a momentary interruption for lateral faults.

[v]       The quality of a call is given by its Mean Opinion Score (MOS), a subjective measurement where listeners sit in a quiet room and rate a telephone call on a scale of 1 to 5. It has been in use in the telephony industry for decades and was standardized in an International Telecommunication Union (ITU) recommendation.

Wind and Solar PV Are Becoming a Chinese Story

In 2015, China became world’s largest producer of photovoltaic power, and this is clearly a policy enshrined in the 13th five-year plan (2016-2020).[i] This plan calls to increase installed wind power capacity to 210 GW and solar PV capacity to 105 GW by 2020 – about a third more than in 2016, although developers’ enthusiasm means that the solar PV 2020 objective will be achieved in 2018, given 34 GW added in 2016 and 54 GW in 2017 – more than the rest of the world combined. To put this 54 GW in context, it is a third more that the nameplate capacity of the electricity producers in the province of Québec.[ii] However, contrary to what happened in Europe, China’s policy followed the initial price reduction in wind and solar power. If Europe lit the renewable fire some time ago, China now fuels it.


Figure 1 The growth of wind and solar PV capacity saw Europe leading in early years, but China is now the main source of growth.[iii]

China now dominates new installed capacity for wind and solar PV, and this keen interest is enshrined in its 5-year plans – China will continue to have the largest share for years to come.

You may have noticed how small wind and solar PV capacities are in Canada in comparison to the rest of the world – just 12 GW for wind and 3 GW for solar PV, and barely visible in Figure 3. Canada is a small player for wind and solar PV. The rest of the world adds as much wind and solar PV capacity per year as the entire electricity generation capacity currently installed in Canada, all sources combined.

While new generation capacity from wind and solar is being installed at an increasing rate, investments have been essentially flat since 2011, compressed by dropping unit costs:[iv]

Figure 2 While new generation capacity from wind and solar is being installed at an increasing rate, investments have been essentially flat since 2011.

With lower unit costs per MW, developers can install more capacity for a given investment. This phenomenon can be expected if wind and solar technologies follow a pattern like Moore’s Law – we are not paying more for a computer than we did years ago, we are just getting more for the same price (or even lower price).

This flat 2011-2017 trend also masks major difference across the world: China’s new wind and solar investments went from $42B in 2011 to $123B in 2017 – almost half of global investments. Conversely, European investments went down in the same period, while North America was relatively flat. Canada’s investments in 2017 were a modest $3B.

The domination of Chinese investments is even greater when one considers China foreign investments in clean energy. China being already the largest market for renewable energy, it is developing the renewable sector internationally, aiming to be a leader along the entire value chain. China’s Belt and Road Initiative (BRI) is driving Chinese energy investments overseas. The initiative already has driven solar equipment exports of U.S.$8 billion.[v] China is not content to be a manufacturer and it is also looking for opportunities to develop Engineering, Procurement and Construction (EPC) standards that it can apply internationally, plus operating credentials. China is building corporate giants to fulfill those ambitions, such as Shenhua Group, now the largest wind developer in the world, with 33 GW of capacity.[vi] In 2016, Xinjiang Goldwind ranked 3rd for onshore and also 3rd for offshore wind turbine manufacturing[vii]. China has become the number one exporter of environmental goods and services, overtaking the U.S. and Germany.

————————–

[i]        See https://www.iea.org/policiesandmeasures/pams/china/name-161254-en.php and https://translate.google.com/translate?hl=en&sl=auto&tl=en&u=http%3A%2F%2Fwww.nea.gov.cn%2F2016-12%2F19%2Fc_135916140.htm, accessed on 20180116.

[ii]       Statistics Canada. Table 127-0009 – Installed generating capacity, by class of electricity producer, annual (kilowatts), http://www5.statcan.gc.ca/cansim/a47, accessed 20180131. In 2015, public electricity producers in Québec had an installed generating capacity of 37 GW, while privates ones has 3 GW.

[iii]      IRENA (2017), Renewable Energy Statistics 2017, The International Renewable Energy Agency, Abu Dhabi, with estimates based on Bloomberg New Energy Finance for 2017.

[iv]       Clean Energy Investment Trends, Abraham Louw, Bloomberg New energy Finance, January 16, 2018.

[v]        China 2017 Review, Institute for Energy Economics and Financial Analysis (IFEEA), p. 2.

[vi]       https://www.reuters.com/article/us-china-power-shenhua-guodian-factbox/factbox-shenhua-and-guodian-chinas-latest-state-marriage-idUSKCN1B918I, accessed 20180118.

[vii]      https://about.bnef.com/blog/vestas-reclaims-top-spot-annual-ranking-wind-turbine-makers/, accessed 20180118.

CEA Tigers’ Den Workshop

On February 21, 2018, I presented at the annual T&D Corporate Sponsors meeting of the Canadian Electricity Association. This year, the formula what similar to the “dragons” TV program, with presenters facing “tigers” from utilities. They asked me to go first, so I didn’t know what to expect, but it went well. Or, at least, the tigers didn’t eat me alive.

The theme was a continuation of my 2017 presentation, this time focusing on what changes utilities need to effect at a time of low-cost renewable energy.

I’ve attached the presentation, which was again largely hand-drawn: CEA 20180221 BMarcoux.

Utilities Should Lead the Change

I have worked in the telecom industry as head of marketing, in customer care and as a business consultant — I saw what happened there. More recently, I have also seen some of the best and the worst of stakeholder communications at electric utilities — including while I directed a large smart meter deployment, a very challenging activity for customer relationships. Beyond the obvious like using social media, online self-support, and efficient call center operations, There is one thing that electric utilities should do to improve their chances to maintain healthy customer relationships as the industry is transforming: lead the change.

“Someone’s going to cannibalize our business — it may as well be us. Someone’s going to eat our lunch. They’re lining up to do it.”

That was Alectra Utilities CEO, Brian Bentz, speaking at the Energy Storage North America in 2017.[i]

Utilities have a choice: lead change or have change done to them. The latter might hurt customer satisfaction more than the former.

Like telephone companies of the past, electric utilities could try to forestall the coming change, or even to reverse it, hoping to get back to the good old days. In fact, this is rather easy, as there is a lot of inertia built in a utility, often for good reasons: public and worker safety, lifelong employment culture, good-paying unionized jobs, prudency of the regulated investment process, long-lasting assets, highly customized equipment and systems, public procurement process, dividends to maintain for shareholders, etc. For utility executives, effecting change is never easy.

In the end, however, resisting change is futile. Customers are able to start bypassing utilities by installing solar panels and storage behind meters, keeping the utility connection as a last resort. It is just a matter of time before the economics become good enough for many industrial, commercial and residential customers, with or without net metering. Customers will do it, grudgingly, but they’ll do it. This will also leave fewer customers to pay for the grid, sending costs up and stranding assets, therefore increasing rates for customer unable to soften the blow by having their own generation, further antagonizing the public… A death spiral of customer satisfaction.

So, what should utilities do? Here are three examples of utilities that have embraced change and made it easy for their customers to adopt change:

  • Green Mountain Power (GMP) in Vermont helps customers go off the grid. Combining solar and battery storage, the Off-Grid package provides GMP customers with the option to generate and store clean power for their home that would otherwise come from the grid.  The Off-Grid package is customized for each customer and includes: an energy efficiency audit, solar array, battery storage, home automation controls, and a generator for backup. Customers pay a flat monthly fee for their energy.[ii]
  • GMP is also deploying up to 2,000 Tesla Powerwall batteries to homeowners. Homeowners who receive a Powerwall receive backup power to their home for US$15 a month or a US$1,500 one-time fee, which is significantly less expensive the US$7,000 cost of the device with the installation. In return, GMP uses the energy in the pack to support its grid, dispatching energy when it is needed most.[iii] Not surprisingly, results of a recent GMP customer satisfaction survey showed that customer satisfaction continues to rise.[iv]
  • ENMAX proposed to use performance-based regulation to the Alberta Utility Commission (AUC). The AUC set the regime in 2009. performance-based regulation has since then been expanded to other Alberta utilities. ENMAX stated that a number of efficiency improvements and cost-minimizing measures were realized as a result of its transition to a regulatory regime with stronger efficiency incentives. ENMAX indicated that it would not have undertaken these productivity initiatives under a traditional cost of service regulation.[v]
  • PG&E selected EDF Renewable Energy for behind-the-meter energy storage. The contract allows EDF RE to assist selected PG&E customers to lower their utility bills by reducing demand charges, maximizing consumption during off-peak hours, and collecting revenue from wholesale market participation. [vi]

References:

[i]         As reported by UtilityDIVE, https://www.utilitydive.com/news/alectra-utilities-ceo-someones-going-to-cannibalize-our-business-it-ma/504934/, accessed 20180102.

[ii]        See https://www.greenmountainpower.com/press/green-mountain-power-first-utility-help-customers-go-off-grid-new-product-offering/, retrieved 20171229.

[iii]        See https://www.tesla.com/blog/next-step-in-energy-storage-aggregation, retrieved 20171230.

[iv]       see https://www.greenmountainpower.com/press/green-mountain-power-survey-shows-customer-satisfaction-continues-rise/, retrieved 20171230

[v]        Performance Based Regulation, A Review of Design Options as Background for the Review of PBR for Hydro-Québec Distribution and Transmission Divisions, Elenchus Research Associates, Inc., January 2015, page A-25.

[vi]       See http://www.energystoragenetworks.com/pge-selects-edf-behind-meter-energy-storage-contract/, retrieved 20171230.

A Critique of the National Energy Board Assessment on Canada’s Energy Future

The NEB published its 2017 assessment on Canada’s energy future a few weeks ago. The NEB, purposely an independent national energy regulator, published this report, part of the Energy Futures series, to be used, among other things, as an input for sound policy making. However, I find it lacking coherent vision.

Curiously, the assessment starts with an admission of failure, with its first “key finding” that the 2017 Energy Futures report is the first where fossil fuel consumption peaks within the projection period. Indeed, each subsequent update since the first Energy Futures in 2007 shows lower and lower fuel use projections:

The chart can be interpreted in two ways: the NEB had it wrong in the past, and now they have it right, or, the NEB must again be getting it wrong. Looking at the assumptions shows that it is the later. While the NEB projects a peak in consumption, it also projects higher oil prices (from $50 to $65–80 per barrel of Brent, depending on scenarios), which is rather surprising, especially since it also projects a constant increase in supply for oil sands, up 59% by 2040 in comparison to 2016.

While the report includes projected price for fuel and gas, it, strangely, does not include projection for the price of electricity. There are, however, a number of projections on the change in generation mix and underlying cost and demand trends.

All scenarios show a (modest) increase in the share of electricity in the national energy mix. The “Technology Case” scenario, the most optimistic one toward clean energy, shows a shift toward more electricity and reduced overall demand in the end-use sector, and more renewable generation in the electricity sector—but the changes are rather small. This modesty is justified by a number of assumptions.

The report projects an increase in new electric passenger vehicles—but growth flattening after 2025, justified by the phase out of incentive programs. Essentially, the NEB assumes that EVs will never be truly competitive with internal combustion cars.

On renewables, the NEB an increase in generation and a decrease in costs under all scenarios. However, the projections are nevertheless surprising. The report acknowledges that solar costs have been coming down 20% a year since 2010:

Then, the report projects that future costs will continue to drop at … 3% to 5% per year:

There is no explanation on what might have happened in 2016 or 2017 to explain this surprising shift.

As a consequence, the projection for non-hydro renewable is rather modest, with much slower growth in the future:

I cannot condone these NEB projections, as they run contrary to what I see in the market.

I just hope that no one uses them to justify how to spend my tax dollars.

Impact of Regulatory Regimes on Executive Behavior

Few outside the executive suite of utilities really appreciate how the regulatory regime affects executive behavior. As understanding behavior is key to selling, I am sharing my thoughts below, applicable mainly to North American utilities.

Problem Statement for Executives of Investor-Owned Utilities 

Given their monopoly over a defined territory, North American Investor-Owned Utilities (IOU) are subjected to price regulation by the state or the province, meaning that a regulator (such as a public service commission, a public utility commission or an energy board) sets the price they charge for the use of their infrastructure (poles, conductors, cables, transformers, switches, etc.).

Most North American IOUs are under rate-of-return regulation, or a variation of it. With rate-of-return regulation, regulator set the price so that utilities are compensated for their costs (operating costs, depreciation on assets, and taxes) and allowed a fair return on their investment. This is done by filing tariffs that are approved by the regulator following a rate hearing.

Utility executives are paid to maximize shareholder returns. Since utility shareholders are rewarded by a fair rate of return on a base of assets, executives create shareholder value by justifying more assets to the regulator while lowering the risk profile that shareholders perceive in future earnings. However, the regulator only allows new asset expenditures if they are prudent and if the society benefits. A capital expenditure is prudent if the costs are reasonable at the time they are incurred, and given the circumstances and what is known or knowable at this time. The society benefits if the expenditures minimize the required revenue paid by ratepayers, have a positive impact on the economy (such as improved reliability), improve customer service (such as fewer complaints), reduce societal risks (such as those caused by major weather events or those linked to information security), or achieve government policies and meet regulations (such as renewable generation targets). By constantly meeting regulatory concerns, utility executives ensure that the utility will be compensated through rates, with predictable earnings and minimizing the risk profiles that investors perceive. Conversely, when a utility fails to show that it is making prudent decisions or that the society benefits, then the regulator may disallow investments from the rate base. In such a case, shareholders bear the shortfall through reduced earnings and share value.

For utility executives, the fundamental objective is to select investment projects that minimize required revenue (a regulatory term defined as operating expenses + depreciation + taxes + return on assets) while being prudent and maximizing societal benefits (to ensure approval). These projects increase the regulated base of assets while minimizing the shareholder risk profiles. This is why utility executives are generally willing to trade lower operating expenses (which is the only other controllable element in the definition of required revenue) for higher capital expenditures. It is also why they are seeking ways to lower operating expenses through subcontracting or outsourcing, as it frees revenue to justify additional capital expenditures. This is often expressed as a rule of thumb, such as “we are OK with $10 of capital to save $1 of operating expenses”, although regulatory approval is always required.

Expressions such as “equipment failures hurt the bottom line” make little sense for a utility executive: if an old equipment that failed is replaced by a new one, that’s actually good, as the old one is written off (the loss being recovered from the ratepayers) and a new asset is added to the base (for which shareholders will get a return). Similarly, the expression “reducing operating expenses improves your bottom line” is not absolutely true – such reduction eventually accrues to ratepayers, not shareholders, but often just to offset other increases. However, it can be true in a sense if the reduced operating expenses are the result of capital expenditures that increase the asset base and, hence, the return paid to shareholders. Hypothetically, utility executives should want to replace all (non-executive) workers (i.e., operating expenses) by robots (i.e., capital assets).

This leads to a number of factors that utility executives ponder when deciding on new investment projects. They will be inclined to support an investment project before their regulator if it results in a combination of the following factors, arguably ordered from the strongest down:

  • Meeting governmental obligations:
    • Meeting statutory obligations, such as workers’ health and safety regulations and CIP V5 cybersecurity standards.
    • Meeting policy obligations, such as integrating renewable sources in the distribution network, energy conservation programs, removal of PCB or oil filled equipment, and reduction of greenhouse gas emissions.
    • Prudency, which determines if the costs are reasonable with what is known at the time of filing.
  • Lower rate impact:
    • Lower operating expenses, such as avoiding overtime truck rolls.
    • Lower energy costs for rate payers, such as if technical losses are diminished.
    • Stretched service life or reduced maintenance costs of existing assets, such as by limiting stress on station transformers installed 50 years ago and approaching end-of-life.
    • Lowering carbon taxes.
  • Reduced societal risks:
    • Greater resiliency during major events, such as looping distribution feeders and underground construction.
    • Better public safety, such as avoiding forest fire.
  • Positive impact on the economy:
    • Reducing sustained or momentary outage costs.
    • Three-phasing of rural lines to better serve C&I customers.
  • Improved quality of service:
    • Improved customer service metrics, such as fewer customer complaints from flickers.
    • Fairness among customers, such as improving reliability experienced by customers in rural areas to approach that of urban areas.

Each utility operates in its own regulatory and societal environment. Therefore, the relative importance of these factors varies between utilities. In particular, some price-cap regulation is starting to appear in North America. With price-cap regulation, prices are set from a starting point and then adjusted according to an economic price index (such as CPI) minus some expected productivity improvement and plus or minus incentives. However, few states and provinces have moved to price-cap regulation for electric utilities. Also, given that the starting point of price-cap is rate-of-return, and given that unforeseen events may cause utilities to petition regulators for additional capital spending, the difference in executive behavior between the 2 regimes may not be as large as one might think. Still, with utilities under price-cap regulation, it is better to talk about total cost of ownership than about capital spending. Some utilities also have quality of service incentives that increase the importance of reliability indices.

Problem Statement for Executives of Customer-Owned Utilities 

Customer-Owned Utilities (COU), essentially cooperatives and municipal utilities, are often regulated by their local government (such as a city council), just like other city services like water and waste disposal. They typically have a shorter feedback loop with customers than IOUs. Contrary to executives of investor-owned utilities, executives of customer-owned utilities do not have an incentive to maximize their base of assets, so tradeoffs may favor more operating expenses, especially so since they are seen as good employers in their communities. Investment decisions will weigh more on societal benefits and risks, with emphasis on customer service and quality of service. Therefore, it is important to adjust the language, as insisting on capital investments only does not make sense for customer-owned utilities.

Large Canadian provincial utilities and municipal utilities across North America are publicly owned, like traditional COUs, but often pay dividends to their owners. Their behavior is normally somewhere between those the IOU and COU extremes, especially if most of the rate increases can be shifted to generators.

The Cost of Outages Is a Policy Issue

Based on my work with Canadian and Australian utilities, the cost of outages is first a policy issue – not a regulatory one, not an operation one. Arguments based on the cost of outages may resonate with policy makers, including Smart City stakeholders, because of public pressure or impact on the economy at large. However, these arguments do not resonate with regulatory agents (who follow policies) nor with utilities (who do not have customer outage costs in their financial statements. Individual users may or may not know their specific costs related to outages, but broad outage cost assessments will not affect them

While utility customers are the ones bearing the cost of outages, multiple surveys have shown that customers are not willing to pay more for more reliable power. Even in individual cases, where a utility would propose to split specific reliability improvement costs with industrial users, the customers decline even though the associated payback period was much shorter than would be required for other purchasing decisions. Essentially customers are saying to policy makers and regulators that they pay enough and that reliability is something that is just expected. Public opinion, regardless of the actual costs incurred, is a powerful tool for disgruntled customers, who can vote policy makers in or out of office. Public opinion may incite policy makers to act, requiring utilities to invest in reliability improvement

This being said, customers incur real costs when an interruption occurs, but accurately capturing these costs is elusive – the ICE calculator is the best developed attempt at estimating overall economic costs. Policy makers, stewards of the economy, can be sensitive to the economic cost argument, when reliability improvement costs are seen through the lens of an industrial policy, with may lead to subsidies to improve reliability

The regulatory agencies follow policies. Traditionally, rates that utilities charge are based on the cost of generating, transmitting and distributing. In return for their obligation to serve customers in an exclusive service territory, utilities are allowed a guaranteed rate of return on their capital expenditures. Reliability is attained tacitly through conservative engineering and maintenance activities. However, policy and regulatory changes over the last 20 years or so have put tremendous pressure on utilities to reduce their costs, and many have gone through or are still going through massive downsizing. As a direct consequence, reliability suffered for some systems. If reliability incentives or penalties are used, reliability targets are typically based on historical values, not the economic costs of outages

Utilities would like to invest more to improve reliability. These investments would add to the asset base upon which investors get a guaranteed return. However, regulators may not let utilities spend for reliability improvement because of the impact on rates unless policy requires them to

Since outage costs may resonate with policy makers, it is a worthwhile argument for Smart City initiatives. Cities cannot function without electricity. It moves subways and trains. It cools, heats and lights our homes and businesses. It pumps our water and keeps fresh the food we eat. And it powers the technologies that are the foundation of a Smart City. By implementing smart grid technologies such as microgrids and distribution automation, electric utilities play a key role in making cities both resilient and sustainable. Yet, many electric utilities do not partner with mayors to work on cities’ resiliency and sustainability challenges. Policy makers could then use outage cost arguments when working with their utilities on reliability improvement initiatives.


Tutorial: Key Players in the Energy Markets: Rivalry in the Middle

See also the previous post.

The players described in the previous post have vastly different characteristics. The most striking difference is the level of rivalry.

IMG_2174

Distributors operate in a defined territory, often corresponding to a city, a state or a province, where they are the sole provider – thankfully, as there would otherwise be multiple lines of poles along roads. Given this monopoly, distributors are subjected to price regulation, meaning that the price they charge for the use of their infrastructure (poles, conductors, cables, transformers, switches, etc.) is set, typically equal to their costs plus an allowed return on their investment. This is done by filing tariffs that are approved by the regulatory body following a rate hearing.

Retail is often a competitive industry, as there is no structural barrier to having multiple players. However, some distributors are also given the retail monopoly over their territory. Some may also provide retail services in competition with other retailers. In those cases, the distributor-owned retailer is also regulated and has to seek approval of its rates, but other retailers typically do not, although they may have to file their rate plans.

It is possible to have multiple transmission companies operating in the same territory, each owing one or a few transmission lines. However, because those transmission lines are not perfect substitutes (they do not necessarily have the same end-points in the network) and because transmission capacity is scarce, electricity transmitter typically have regulated rates, although they may compete for new constructions.

System operators are monopolies over a territory, and they have to maintain independence. They are, in effect, monopolies, although system operators are often government- or industry-owned. Their costs are recharged to the customer base, directly or indirectly.

Large generators are in a competitive business, competing in an open market, although distributed generators, which are much smaller, usually benefits from rates set by a regulator or a government.

Tutorial: Key Players in the Energy Markets

I will be making a conference to investors later this year and I will also be training some people internally at my employer. The topics will touch on the electricity industry structure and I am preparing some material for it.

The industry can be quite complex in some jurisdictions. I boiled the complexity down to just this:

New Picture

Traditional large-scale generator own and maintain coal, natural gas, nuclear, hydro, wind and solar plants connected to transmission lines. Those are large plants – typically hundreds of megawatts.

Transmitters own and maintain transmission lines – the large steel towers seen going from large generators to cities. Those typically run at 120,000 volts and more, up to over 1,000,000 volts in some cases.

Distributors own and maintain the local infrastructure of poles and conduits going to customer sites. Those typically run at 1,200 to 70,000 volts, usually stepped down to 600 volts. 480 volts, 240 volts or 120 volts for connection to customers.

Most customers are connected to distributors, although some large industrial facilities (such as aluminum smelters) are directly connected to transmission lines.

While customers are connected to distributors, they purchase electricity from an independent retailer or from the retail arm of a distributor.

With customer installing distributed generation on their premises, they sell back power to the market, often through aggregators.

Retailers buy electricity from generators in an energy market – like a stock exchange, but for electricity.

By definition, the energy produced at any instant must be equal to the energy taken by customers, accounting for a small percentage of losses in transmission and distribution. (We are starting to see large-scale storage operators, which may act as both consumer and generator, depending they are charging or releasing electricity in the network.) This critical balance is maintained by the system operator that direct generators to produce more ore less to match load; in some case, the system operator will also direct distributors to shed load (customers) if generation or transmission is insufficient to meet the demand.

The next post will deal with energy and money flows in the market.