J’ai lu avec attention ce plan d’action et, surtout, écouté la commission parlementaire du 30 novembre dernier lors de laquelle des membres de la haute direction d’Hydro-Québec ont témoigné. Je présente ici mon analyse personnelle de tout ceci, dans une perspective historique partant des années 60.
Michael Sabia présente ce plan comme un «?projet de société?» et il a répété cette expression plusieurs fois, au point d’en faire le thème central de la commission parlementaire. La vision est ainsi beaucoup plus sociale et économique que le commercialisme de l’ancien président Éric Martel et que la perspective surtout organisationnelle de l’ancienne présidente Sophie Brochu.
Le plan d’action semble cohérent avec un projet de société. Les autres dirigeants de l’entreprise ont ainsi fait de nombreuses références à l’ouverture de l’entreprise pour travailler avec les peuples autochtones, les communautés, les clients, l’écosystème de l’électricité, les promoteurs, etc. On a même mentionné l’ouverture sur le monde en voulant s’inspirer de ce qui se fait de mieux ailleurs. Le plan d’action est d’ailleurs présenté comme étant une première ébauche, sujette justement à des ajustements à la suite de discussions à venir. Je reçois ceci comme un vent de fraîcheur, Hydro-Québec s’étant repliée sur elle-même au cours des dernières années. Le cadre de ces discussions n’est cependant pas précisé.
Le plan d’action «?Vers un Québec décarboné et prospère?» rappelle la période qui a suivi la Révolution tranquille, dans les années 60 et 70. Les gouvernements successifs, unionistes, libéraux ou péquistes, ont alors enclenché le développement des grands ouvrages de Manic-Outardes, qui ont doublé la capacité de production du Québec, de Churchill Falls (au Labrador) et de la Baie-James, qui l’ont encore doublé. Aujourd’hui, on parle à nouveau de doubler à l’horizon 2050. Mais augmenter la capacité de production ne fut pas le seul objectif des gouvernements.
Dans les années 60 et 70, les gouvernements ont aussi utilisé la construction des grands ouvrages pour permettre aux Québécois francophones de prendre en main le développement économique de la province. Ce développement économique fut à la fois dans le secteur secondaire (fabrication d’équipement électrique et alumineries) et dans le secteur tertiaire (grandes firmes de génie-conseil et, un peu plus tard, en technologies de l’information). On entend encore les échos de cette décision d’avenir, car le Québec est aujourd’hui le pôle canadien de fabrication de matériel électrique : nous avons proportionnellement 2 fois plus d’emplois en fabrication de matériel électrique que le reste du Canada, tout au long de la chaîne de valeur, et des PME aux multinationales. Cette période voit aussi l’émergence de firmes québécoises de génie-conseil de calibre international, dont certaines sont parvenues au top-10 mondial, comme SNC-Lavalin.
On peut s’inspirer de ce parallèle historique, tout en constatant que la situation actuelle présente ses caractéristiques propres.
On parle encore d’hydroélectricité appuyée par le savoir-faire d’Hydro-Québec, bien évidemment, mais beaucoup d’éolien et de solaire, filières moins coûteuses, plus décentralisées, plus rapides à implanter, et utilisables directement par les clients. Au fil des grands projets hydroélectriques, dès les années 50, Hydro-Québec est devenue experte dans la gestion de ces projets, largement livrés à temps et dans les budgets. C’est exceptionnel dans le domaine — on n’a qu’à penser aux dépassements des projets Site C en Colombie-Britannique et Muskrat Falls au Labrador. Or, Hydro-Québec n’a pas le même savoir-faire pour l’éolien et le solaire que pour l’hydroélectricité, alors que plusieurs développeurs ont déjà acquis une expérience considérable en éolien et en solaire en Europe, aux États-Unis ou en Asie. Certains de ces développeurs sont même basés ici, comme Boralex et Brookfield. Dans le plan d’action, Hydro-Québec semble ouverte à continuer à travailler avec des développeurs, et je crois que c’est bien ainsi, pour éviter à notre tour des erreurs coûteuses.
On parle aussi de plus de lignes et de postes de transport vers nos voisins, et pas seulement pour l’exportation, mais aussi pour utiliser nos ouvrages afin d’équilibrer la production renouvelable intermittente ici et ailleurs — une très grande valeur économique. Pour ce qui est des lignes de distribution dans les villes et les campagnes, elles ont été mises à niveau lors des vagues d’électrification des années 60 à 80, mais plusieurs équipements arrivent en fin de vie. C’est en partie ce qui explique la dégradation de la fiabilité du service depuis une dizaine d’années. Or, la fiabilité sera d’autant plus nécessaire que la société sera plus dépendante de l’électricité. Le plan fait mention de réduire les pannes de 35 % d’ici 7 à 10 ans, ce qui semble peu ambitieux puisque les pannes ont doublé depuis 10 ans. Tout de même, plusieurs technologies et façons de faire sont considérées pour redresser la situation, avec des infrastructures physiques plus résistantes ou résilientes (conducteurs recouverts, entrecroises flexibles, poteaux en composite), des systèmes de protection (plus de réenclencheurs, réenclenchement monophasé, réseau plus maillé, automatismes, etc.), ou encore avec une meilleure maîtrise de la végétation.
Depuis les années 70, Hydro-Québec a périodiquement mis l’accent sur l’efficacité énergétique, surtout dans les années immédiatement avant la mise en marche d’une nouvelle centrale, abandonnant cependant ces programmes dans les années suivantes, lors de surplus. Ces programmes furent surtout administrés par des firmes privées mieux capables de rejoindre efficacement les nombreux clients, comme la firme de génie-conseil Dessau pour le programme Énergain au début des années 80. Aujourd’hui, la participation active des clients, passifs consommateurs en 1960, est nécessaire pour atténuer les pointes de demandes et consommer efficacement l’électricité. On parlera donc aussi de programmes de gestion de la demande, en plus d’efficacité énergétique. Les programmes comme la «?GDP affaires?» (gestion de pointe pour les clients commerciaux, institutionnels ou industriels) avec des agrégateurs privés et l’entente récente avec Sinopé pour automatiser la tarification dynamique sont probablement appelés à se multiplier. Certains clients seront aussi autoproducteurs, avec des systèmes solaires (et éoliens pour certains industriels) installés par des tiers. La collaboration avec les clients et l’écosystème de l’électricité sera nécessaire, même si elle prendra différentes formes qu’il y a 40 ou 50 ans.
En industrialisation, on ne parle plus d’alumineries mais de secteurs nécessaires à la transition, comme la fabrication de batteries. En 1970, on promettait des emplois pour se faire élire, mais nos entrepreneurs et industriels sont maintenant en pénurie de main-d’œuvre et doivent automatiser leurs usines.
Dans les discussions à venir sur ce projet de société, il y aurait lieu, je crois, d’avoir aussi des discussions sur des points qui pourraient faire polémiques. Mieux vaut aborder ces points maintenant si on veut arriver à un consensus durable envers ce projet de société.
Par exemple, l’écosystème de l’électricité ne réalise pas son plein potentiel d’innovation. Il n’en a pas toujours été ainsi, car la Révolution tranquille a vu l’innovation québécoise se démarquer. Ainsi, les lignes de transport d’électricité à 735?000 volts, inventées ici et inaugurées en 1965, sont demeurées les lignes à la plus haute tension dans le monde jusqu’en 1982, seulement alors surclassées par une installation d’Union soviétique. Depuis, Hydro-Québec a fait plusieurs tentatives de commercialisation d’innovations du centre de recherche d’Hydro-Québec, avec des filiales comme Nouveler, Capitech et Industech. Les résultats n’ont pas été à la hauteur des attentes. Ailleurs au Québec, même si l’innovation est au cœur des préoccupations des entrepreneurs et des industriels engagés dans la transition énergétique, on se doit de constater que l’écosystème ne réalise plus son plein potentiel, avec des barrières importantes, en particulier à ce qui a trait à la commercialisation. L’ouverture énoncée dans le plan pourrait donc devenir un accélérateur d’innovation par les entrepreneurs et industriels d’ici. Pour appuyer l’écosystème, on devrait peut-être repenser le rôle du centre de recherche d’Hydro-Québec pour en faire un moteur d’innovation, en s’inspirant de modèles existants ailleurs. Par exemple, en Colombie-Britannique, Powertech Labs est une filiale de BC Hydro très active dans la certification de produits électriques et plusieurs de nos entrepreneurs y font tester leurs nouveaux designs. En Ontario, Kinectrics, issue de la privatisation d’Hydro Ontario Research Division il y a une vingtaine d’années, est maintenant présente dans 7 pays et œuvre aussi dans le domaine des tests d’appareillages électriques. Un troisième modèle pourrait être le Lawrence Berkeley National Laboratory aux États-Unis, avec une mission de recherche appliquée peut-être plus conforme au nom officiel du centre de recherche, l’Institut de recherche en électricité du Québec (IREQ). Ces exemples et d’autres devront être discutés avec toutes les parties prenantes, y compris les entrepreneurs et industriels du secteur ainsi que le personnel de l’IREQ.
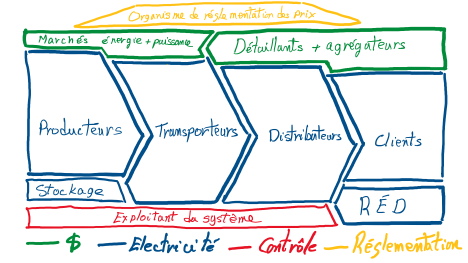
Tant qu’à avoir des discussions difficiles, il faudra aussi étudier les réformes de l’industrie qui ont eu lieu en Europe au cours des dernières décennies. Ce fut en particulier le cas en Norvège et en Suède, qui, comme le Québec, sont des régions largement alimentées à l’hydroélectricité dans un climat nordique. En général, les points forts de ses réformes ont été le dégroupage du secteur et l’introduction d’un marché de l’électricité. On a donc divisé les opérations du système électrique en transport et distribution d’électricité, qui sont des monopoles naturels, et la production et la vente d’électricité, qui ont été soumises à la concurrence. En outre, un marché de gros de l’électricité avec des prix fluctuants a été introduit en plus d’un marché de détail où les consommateurs pouvaient choisir leur fournisseur d’électricité.
D’emblée, je dois dire que je ne vois aucun appétit de privatisation d’Hydro-Québec (à l’image d’Hydro One en Ontario) ni pour revoir le mandat d’exploitation des forces hydrauliques comme stipulé dans la Loi sur Hydro-Québec. De plus, les lignes de transport et de distribution utilisées pour fournir le service au public sont un monopole naturel local qui n’est pas remis en question, mais Hydro-Québec n’est pas le seul exploitant au Québec, puisqu’il y a 10 autres distributeurs d’électricité (9 municipalités et une coop) et quelques lignes de transport privées entre des installations industrielles. Cependant, on pourrait comparer les avantages et les inconvénients de réformer le secteur à l’image des Européens. Ceci amènerait aussi la discussion vers le besoin d’avoir un exploitant indépendant («?Independent System Operator?») comme ailleurs en Amérique du Nord. Ce seraient certainement des discussions animées, opposant des vues très différentes, mais nécessaires pour avoir les conditions gagnantes pour effectuer une transition énergétique porteuse de prospérité. Un défi constant lors de ces discussions sera d’aller au-delà des phrases clichés et de partager une compréhension commune des enjeux et des possibilités — l’industrie de l’électricité est complexe et le «?gros bon sens?» nous amène rarement aux bonnes conclusions.
En conclusion, je crois qu’il y a assez peu à critiquer sur ce plan d’action initial proposé par Hydro-Québec, aligné avec les volontés gouvernementales et somme toute bien réfléchi. Les quelques critiques que j’ai entendues sont surtout en amont ou en aval. En amont, Hydro-Québec est un instrument du gouvernement du Québec, et on ne peut lui reprocher d’agir en conséquence. Par exemple, certains critiquent l’allocation de 25 % de l’électricité supplémentaire pour la croissance économique, préférant mettre l’accent sur la réduction de la consommation. Cependant, c’est une décision gouvernementale à laquelle Hydro-Québec ne fait que répondre, et on ne peut lui reprocher ceci. En aval, d’autres soulignent les risques à exécuter ce plan, comme pour ce qui est de la pénurie de main-d’œuvre, de l’incertitude sur les besoins futurs ou des imprévus associés au développement des centrales de production. Tout vrai, mais j’ai déjà fait plusieurs plans stratégiques dans des contextes de transition, et les meilleurs sont à la fois ambitieux et itératifs?; les détails deviendront plus clairs au fur et à mesure.
En fait, c’est là la clé : il faut discuter de ce projet de société entre nous, s’inspirant de ce qui se fait ailleurs, dans des forums qui laissent place à toutes les perspectives.


