Summary:
Insight 1
Utility-scale solar PV costs are dropping ~20% a year (including solar panels, inverters, balance-of-system, installation, and operations) while panel efficiency is improving. Solar is the renewable sector with the most patents, promising further improvements.
Insight 2
Onshore wind costs are dropping ~6% a year, and onshore wind is currently the least expensive new generation source. Wind turbine technology continues to improve through a combination of taller towers and wider rotor diameters.
Insight 3
Prices are below 2¢/kWh (unsubsidized) for projects auctioned to be delivered in 2019 and 2020. Continuing cost drivers include: larger-scale manufacturing in low-cost locations, tighter integration, higher performance, larger farms with better economy of scale, repowering of old sites with good wind or solar resources, and automation of operations.
Insight 4
The cost reduction curve of commercial solar PV over time is about two years behind the cost curve of utility-scale solar farms. Residential is two years behind commercial. Southern Alberta and Saskatchewan have the best solar resource in Canada, one year behind Southern United States. The rest of Southern Canada is just another year behind.
The rate of cost reduction in wind and solar PV systems has been wholly impressive. Solar PV modules are 20% of the cost they were in 2010. Wind turbine prices have fallen by around half over a similar period, depending on the market. Costs are dropping so quickly that some governments feel compelled to protect fossil generators. For example, in 2017, there was a bill in front of the Wyoming State Legislature to tax renewables in order to favor local coal producers. The bill went nowhere, but you know that you are onto something when it is being taxed.[i] Similarly, the U.S. Department of Energy attempted to protect coal and nuclear producers in the name of keeping power grids dependable, but this was eventually rejected by the Federal Energy Regulatory Commission in early 2018.[ii]
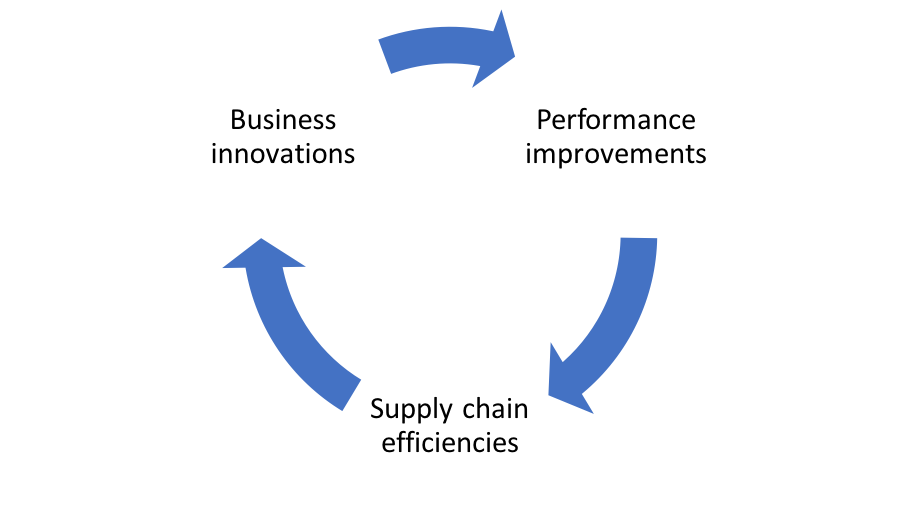
Spurred by a global competitive race sponsored by states and large corporations, a confluence of performance improvements, supply chain efficiencies and business innovations is driving cost reduction trends for renewables, with effects that will only grow in magnitude in 2018 and beyond.
Figure 1 A confluence of performance improvements, supply chain efficiencies and business innovations is driving cost reduction trends for renewables
Performance improvements
The last decade has seen a string of innovations and inventions for renewable energy technology. The large number of patents issued is a measure of the level of innovation, and, perhaps surprisingly, China has become the leading innovator by this measure. From 2000 to 2016, over 575,000 patents were filed for renewable energy:[iii]
- Half of them since 2010.
- 55% were for solar energy and 20% for wind energy. Hydropower, a mainstay of Canadian Utilities, accounted for just 6% of patents.
- Greater China (including Hong Kong and Taipei) accounted for almost a third of patents, well ahead of second-place United States at 18%. Canada has less than 1.5% of those patents.
Technology improvements primarily aim at raising the capacity factor, generating more energy from available resources, and reducing installations, operating and maintenance costs.
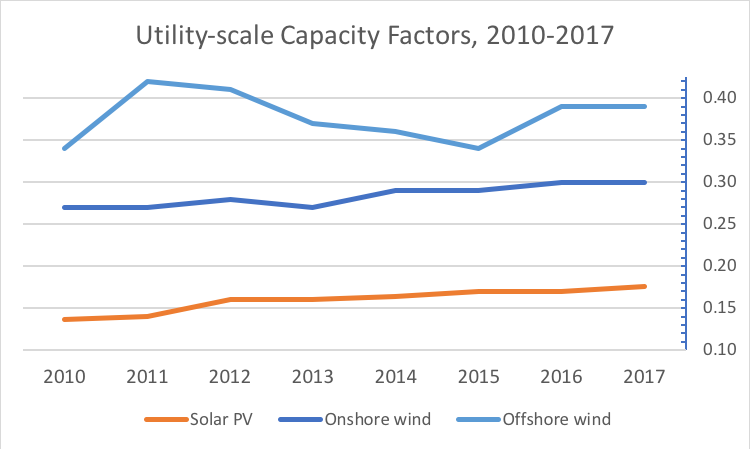
For example, in the last decade, the efficiency of solar PV panel went from about 12% to a range of 18.8-23.5%. By 2424, industry expectations place the range at 19.8-25%.[iv] Increased use of sun tracking for utility-scale plants and improvements in inverter losses are also contributing to the improvement of the capacity factor of solar PV systems, with utility-scale PV systems increasing from an average of 13.7% to 17.6% (see Figure 2).[v]
For wind power, higher hub heights allow turbines to access higher wind speeds[vi], with each additional meter of hub height added to a wind turbine increasing the annual energy yield by 0.5 to 1 percent[vii]. Average rotor diameter and nameplate capacity (in MW) have also significantly increased since 2010[viii]. Offshore installations allow even larger turbines, with the 9.5 MW Vestas V164 currently holding the world record[ix] and General Electric developing an even larger Haliade-X 12 MW model[x]. As the market for wind turbines expands, manufacturers are also offering a broader range of models to allow developers to choose the best models for the site constraints they are facing (e.g., strong winds, light winds, wind variability, setting issues, etc.).[xi] All this contributes to better wind capacity factor: average capacity factor for onshore wind plants increased from around 20% in 1983 to around 29% in 2017, with average capacity factor for newly commissioned offshore plants routinely reaching 40% (see Figure 2)[xii], with a new offshore floating wind farm, Hywind Scotland, achieving a 65% capacity factor from November 2017 through January 2018.[xiii]
Figure 2 Capacity factors of newly commissioned systems have increased since 2010.[xiv]
Supply chain efficiency gains
As the market for renewable power generation systems expands, the industry sees increasing economies of scale in manufacturing, better vertical integration of manufacturers and consolidation among manufacturers, all fueled by a more competitive global supply chain. Again, China stands as a model, for example creating the largest power company by combining Shenhua Group and China Guodian. Groups such as this are active as foreign investment agents of China, using Chinese wind turbines and solar panels, along with Chinese engineering expertise, to develop renewable wind and solar plants across the world.
With larger scale operations, manufacturers are introducing process improvements that reduce material and labor needs, while reducing overhead. The supply chain gets more and more optimized with product better adapted to local markets and resource conditions.
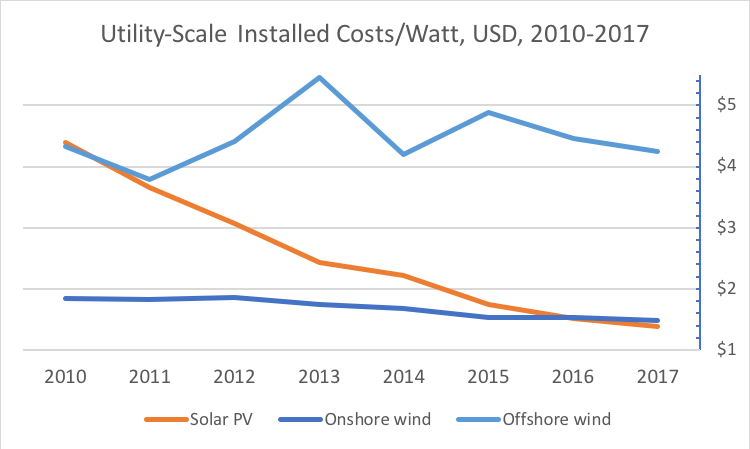
As a result of these efficiencies and a robust international competitive environment for developers, the installed costs of utility-scale solar PV projects fell by 68% between 2010 and 2017. Installed costs for onshore wind projects fell by 20%. For offshore wind, the total installed costs fell by 2%.
Figure 3 Installed costs have come down since 2010, on average 20%/year for solar PV.[xv]
It is striking that wind and solar PV costs went down so much while efficiency went up at the same time.
For wind electricity generation, installed cost reductions have been driven by declines in turbine prices which, which fell from a range U.S.$1,600-2,000/kW in 2008 to U.S.$800-1,100/kW for recent turbine orders.[xvi] In 2017, one developer saw a 30% reduction in turbine costs and foresees another 10% decline per year through 2020.[xvii] Even as price went down, the profitability of turbine manufacturers has generally rebounded since 2012,[xviii] with the price declines explained by turbine scale, offshoring of key components by European manufacturers and the rise of Chinese manufacturers[xix]. As a result of cost decline and the greater efficiency of new turbines, repowering old wind farms with new turbines is gaining traction.[xx]
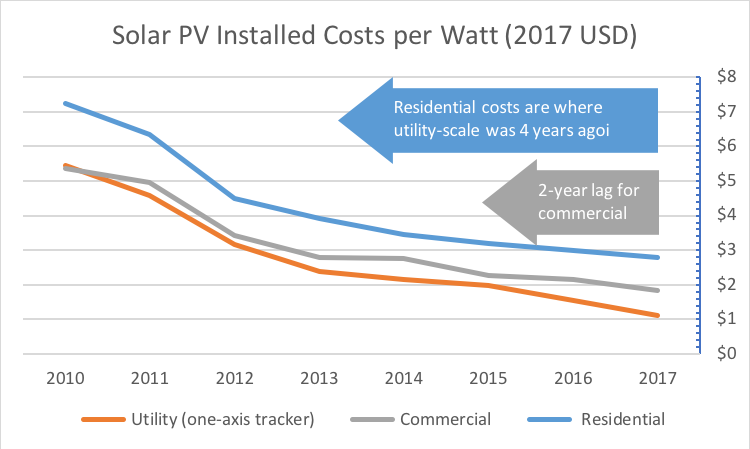
Figure 4 compares the reduction in solar PV installed costs for utility scale (100 MW), commercial (200 kW) and residential solar PV (5.7 kW) in the U.S. market, from 2010 to 2017. Overall, the costs of utility scale have declined 20% per year on average since 2010, while the costs of residential and commercial U.S. systems have declined about 14% per year on average. As of 2017, residential installed costs are 2.5 times higher than utility-scale solar PV; commercial installed costs are in the middle, at 1.8 times. However, in order to appreciate the scale of the reduction, note that the installed costs of residential systems in 2017 are at about the same level as utility scale in 2012 or 2013 – a 4-year lag. Commercial costs are less than 2 years behind utility-scale costs. It only took a couple of years for the cost structure of residential and commercial systems to catch up with utility-scale systems that are orders of magnitude larger! With the efficiency due to the economy of scale up the supply chain, the economy of scale of the PV systems themselves is quickly collapsing. This opens the door for smaller, distributed solar PV systems to have a positive business case.
Installed cost reductions happened in all components of systems, including solar panels, inverters, structural and electrical components, install labor, and even customer acquisition or marketing. However, the cost reductions of solar panels were the largest ones. This was driven by Chinese solar manufacturers, who accounted for about 60% of global solar cell production in 2016.[xxi] China’s dominance in solar manufacturing does not come at the expense of quality, with seven of the top ten largest high-quality manufacturers supplying the U.S. residential market being Chinese.[xxii] Manufacturing capacity expansion increased in 2017, with China accounting for 70% of the expansion.[xxiii]
Figure 4 Installed costs of solar PV came down across all market segments in the U.S., with commercial and residential costs only 2 to 4 years behind utility scale.[xxiv]
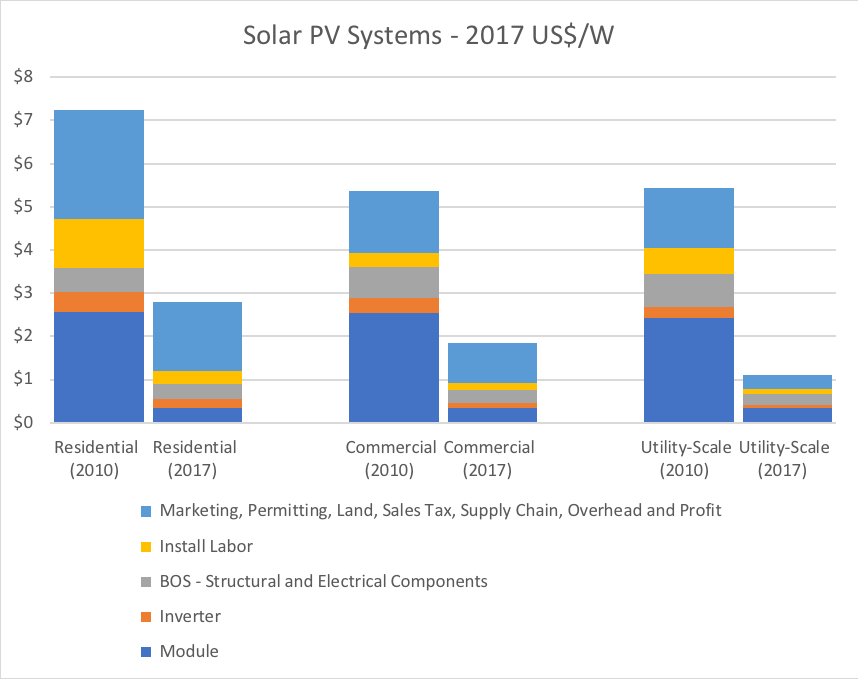
The installed cost reduction of solar PV systems in the U.S. was partly driven by the reduction in solar PV module prices since 2010. Balance of system costs have also fallen, but not to the same extent (see Figure 5). Commercial systems are still relatively custom designs, with relatively high engineering, construction and developer overhead. Residential systems are a retail market, with higher supply chain, marketing, overhead and profit margins than the business-to-business markets. Furthermore, the cost of residential and commercial solar PV system in the U.S. is higher than many other countries. As an example, the installed costs of residential solar PV in Germany were around 37% of those in California in 2016[xxv] and the analysis suggests that there are significant opportunities to reduce the gap, if the right policies are put in place. Another study blames very high overhead in the U.S. for the high cost of residential systems.[xxvi] As the electrical code is adapted and permitting streamlined, this study suggests that residential costs will come down in the U.S.
Figure 5 Installed costs of solar PV came down across all market segments in the U.S., but soft costs remain high in the residential and commercial markets.[xxvii]
Business innovations
On the backdrop of improving performance and supply chain efficiencies, business models, commercial and operating innovation are perhaps the most significant cost reduction factors for developers and operators.
First, experienced international project developers, especially from Europe and China, have developed standardized approaches to project evaluation and construction, minimizing project development risks. These firms are now looking for international opportunities as that some of their home markets are slowing. These firms are generally subsidiaries of large groups, like EDF and Shenhua (the world’s largest wind power developer), with access to low cost of capital. Chinese solar module manufacturers continue to feature strongly in overseas solar generation projects. In 2017, Chinese companies took part in projects across Asia, Latin America, Australia, and Africa. No doubt that operating in cost-sensitive and low-skill developing countries in forcing Chinese developers to innovate even more, probably with the idea to bring those innovations in developed countries later.
Second, competitive procurement get a large number of experienced medium- and large-scale developers competing to develop projects, worldwide. The relatively low barriers to entry also put smaller local players into play. The resulting purchase agreements set the price of energy for typically 20 years, adding predictability to developers’ business case, and driving costs further down than the favorable feed-in tariffs initially used in many jurisdictions (like Ontario).
Thirdly, optimized operational practices and the use of real-time and big data analytics at an increasingly granular level enable predictive maintenance to reduce ongoing costs and generation loss from downtime.[xxviii] For example, new PV panels have built-in diagnostic tools accessible remotely via monitoring software. New wind and solar farms are being designed with serviceability in mind to minimize ongoing operation and maintenance costs. Benchmarking performance and digital twins with advance analytics allow operators to identify areas of improvement. Drones do aerial thermography to identify hotspots while robots clean panels and mow grass. All these tools clearly reflect the increasing maturity of renewable power generation technologies.
[i] http://www.forbes.com/sites/williampentland/2017/01/18/wyoming-considers-de-facto-prohibition-on-solar-and-wind-energy/, accessed 20180118.
[ii] https://www.bloomberg.com/news/articles/2018-01-08/perry-plan-to-help-coal-nuclear-plants-rejected-by-regulators, accessed 20180118.
[iii] International Renewable Energy Agency (IRENA), INSPIRE database, http://inspire.irena.org/Pages/patents/Patents-Search.aspx, accessed 20180121.
[iv] Renewable Power Generation Costs in 2017, International Renewable Energy Agency, 2018, pp. 59-61.
[v] Renewable Power Generation Costs in 2017, International Renewable Energy Agency, 2018, p. 66.
[vi] Wind power in an open-air stream is proportional to the third power of the wind speed. Thus, a wind speed 10% higher means 33% more available power, all other things being equal.
[vii] http://www.mbrenewables.com/en/world-record-for-energy-transition/, accessed 20180121.
[viii] Renewable Power Generation Costs in 2017, International Renewable Energy Agency, 2018, p. 91.
[ix] http://www.mhivestasoffshore.com/worlds-most-powerful-available-wind-turbine-gets-major-power-boost/, accessed 20180121.
[x] https://www.reuters.com/article/us-ge-windpower-france/ge-to-develop-worlds-largest-wind-turbine-in-france-idUSKCN1GD5GW, accessed 20180310.
[xi] General Electric, Siemens and Vestas have all roughly doubled the number of offerings in their portfolio since 2010, with each now offering over 20 models. See Renewable Power Generation Costs in 2017, International Renewable Energy Agency, 2018, p. 90.
[xii] Renewable Power Generation Costs in 2017, International Renewable Energy Agency, 2018, pp. 102-103.
[xiii] https://www.statoil.com/en/news/15feb2018-world-class-performance.html, accessed 20180310.
[xiv] Renewable Power Generation Costs in 2017, International Renewable Energy Agency, 2018, pp. 42-47.
[xv] Renewable Power Generation Costs in 2017, International Renewable Energy Agency, 2018, pp. 42-47.
[xvi] 2016 Wind Technologies Market Report: Summary, Lawrence Berkley National Laboratory, U.S. Department of Energy, p. 43.
[xvii] http://www.investor.nexteraenergypartners.com/phoenix.zhtml?c=253465&p=earningsRelease, accessed 20180130.
[xviii] 2016 Wind Technologies Market Report: Summary, Lawrence Berkley National Laboratory, U.S. Department of Energy, p. 18.
[xix] Globally, Vestas, GE, and Goldwind were the top suppliers in 2016, with Chinese suppliers however occupying 4 of the top 10 spots in the global ranking, based almost entirely on sales within their domestic market.
[xx] https://www.eia.gov/todayinenergy/detail.php?id=33632, accessed 20180202.
[xxi] IEA Renewables 2017: Analysis and Forecasts to 2022.
[xxii] http://news.energysage.com/best-solar-panel-manufacturers-usa/, accessed ???.
[xxiii] China 2017 Review, Institute for Energy Economics and Financial Analysis (IFEEA), p. 3.
[xxiv] U.S. Solar Photovoltaic System Cost Benchmark: Q1 2017, National Renewable Energy Laboratory, Figures ES-1.
[xxv] The Power to Change: Solar and Wind Cost Reduction Potential to 2025, International Renewable Energy Agency, 2016, p. 11.
[xxvi] https://www.greentechmedia.com/articles/read/how-to-halve-the-cost-of-residential-solar-in-the-us?utm_source=Solar&utm_medium=email&utm_campaign=GTMSolar#gs.UscExbA, accessed 20180131. This study shows that the cost per watt in US$3.25 in the US and US$1.34 in Australia.
[xxvii] U.S. Solar Photovoltaic System Cost Benchmark: Q1 2017, National Renewable Energy Laboratory, Figures ES-1.
[xxviii] https://www.bloomberg.com/news/articles/2018-01-12/buffett-s-squeezing-more-power-out-of-wind-with-this-software, accessed 20180120.
