Reduction in installed costs and operation costs (per kW or MW – see https://benoit.marcoux.ca/blog/the-costs-of-wind-and-solar-pv-systems-are-down-way-down/), coupled with free “fuel” converted into electricity at increasing efficiency, translate directly into lower and lower cost of energy (kWh or MWh). The dropping cost of wind and solar energy can be followed in 2 ways. First, analysts compute the costs over the expected life of a plant, estimate energy production and allocate a fair return for owners to come up with the Levelized Cost Of Energy (LCOE). Second, real-life auctions leading to long-term Power Purchase Agreements (PPA) from utility-scale plants provide actual price data.
At the global level, the International Renewable Energy Agency (IRENA) has built a Renewable Cost Database containing the project level details for almost 15,000 utility-scale renewable power generation projects around the world, from large GW-scale hydropower projects to small solar PV projects, down to 1 MW. IRENA also has an Auctions Database which tracks the results of competitive procurement of renewable power generation capacity that are in the public domain. The Auctions Database currently contains auction results for around 7,000 projects, totaling 293 GW. Figure 1 shows the LCOE and auction data for onshore wind and solar PV, illustrating the sharp decline in the cost of electricity experienced from 2010 to 2017, and signaling prices for 2020 from auction data. Auctions are particularly useful to estimate cost trends in the near future. In essence, just like computer designers are forward-pricing based on Moore’s Law, wind and solar PV developers are forward-pricing installed costs for up to 3 years.

Figure 1 Global levelized cost of electricity and auction price show downward trends for utility-scale onshore wind and solar PV.[i]
Based on LCOE, the average cost of electricity from onshore wind fell by 23% from 2010 to 2017. Based on auction price, we can expect the average cost of electricity from onshore wind farms to decline a further 17% by 2020, to US4.7¢ per kWh. Overall, from 2010 to 2020, the cost of electricity from onshore wind has seen an average reduction of almost 6% per year, or 55% per decade.
Based on LCOE, the average cost of electricity from utility-scale solar PV fell by 73% from 2010 to 2017. Looking forward with auction prices, we can expect the average cost of electricity from utility-scale solar PV to decline a further 47% by 2019, to US4.7¢ per kWh. From 2010 to 2019, the cost of electricity from utility-scale solar PV has seen an average reduction of 20% per year, or 87% per decade.
By 2019 or 2020, the best onshore wind and solar PV projects will be delivering electricity for less than 2¢ or 3¢ per kWh, as shown by the record-low auction prices for solar PV in Dubai, Mexico, Peru, Chile and Saudi Arabia.[ii]This is not missed by leading industry executives. During the January 2018 investor call, Jim Robo, Chairman and Chief Executive Officer of NextEra Energy, noted:
- “[Without] incentives, early in the next decade wind is going to be a 2 to 2.5 cent per [kWh] product.”
- “By early in the next decade, as further cost declines are realized, and module efficiencies continue to improve, we expect that without incentives solar pricing will be 3 to 4 cents per [kWh], below the variable costs required to operate an existing coal or nuclear generating facility of 3.5 to 5 cents per [kWh].”[iii]
This executive is saying that generating energy from wind and solar PV will cost less than just burning fuel in existing plants.
Even in Canada?
In December 2017, the Government of Alberta announced the results of its Renewable Electricity Program, for nearly 600 MW of wind generation to be operational in 2019, at prices ranging from 3.09¢ to 4.33¢ per kWh, setting a new record in Canada.[iv]Those wind farms will be located in Southern Alberta, where the onshore wind resources are the best in Canada.
Already now, and increasingly in coming years, some wind and solar PV power generation projects can undercut fossil fuel-fired electricity generation, without financial incentives, and this is coming to Canada very quickly.
Global averages do not reflect the broad variation in the quality of solar or wind resources at any given location. For example, Figure 11shows the LCOE in 3 U.S. cities for utility-scale solar PV: Phoenix, AZ (a southern high-insolation area), Kansas City, MO (an average city in the U.S.), and New York, NY (typical of the North-East). A utility-scale solar PV plant in a high-insolation area like Phoenix can produce electricity for approximately 30% less than a plant in New York. However, all geographies have seen a decline in the cost of generation. Given the average decline of 20% per year, costs in New York are about 18 months behind costs in Phoenix.
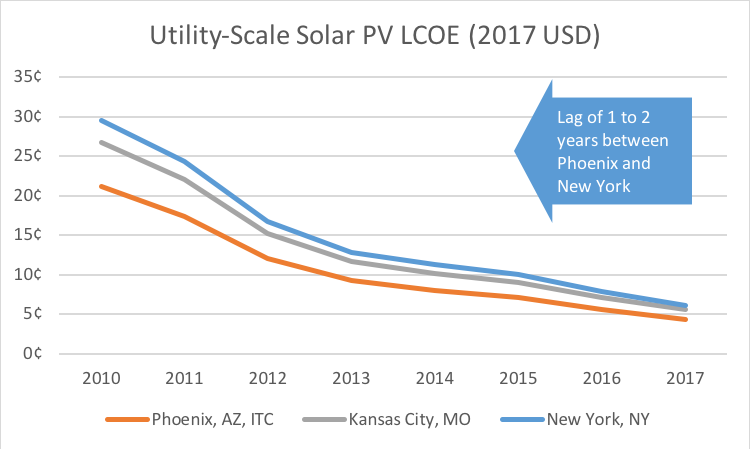
Figure 2 Cost of electricity generated from utility-scale (one-axis tracking) solar PV increases at higher latitudes[v]
Cities with better isolation can be expected to have better solar PV capacity factor, and this is true when comparing U.S. and Canadian cities, as shown in Table 1.
Table 1 Approximate annual generation of a 100-MW tracking solar PV systems in various North American cities[vi]
| City | Annual generation in MWh for a 100-MW system | % vs. Phoenix |
| Phoenix, AZ | 219,000 | 100% |
| Kansas City, MO | 173,000 | 79% |
| New York, NY | 153,000 | 70% |
| Lethbridge, AB | 189,000 | 86% |
| Calgary, AB | 182,000 | 83% |
| Montréal, QC | 146,000 | 67% |
| Toronto, ON | 144,000 | 66% |
| Halifax, NS | 145,000 | 66% |
| Vancouver, BC | 135,000 | 62% |
Based on this table, utility-scale tracking solar PV system in Southern Canada generates approximately 62% to 86% of the electricity generated by a similar system in Phoenix, AZ. Southern Alberta has the best solar resources in Canada, above the U.S. average (represented here by Kansas City, MO).[vii]Given that cost of electricity from utility-scale solar PV sees an average reduction of 20% per year, the large Canadian cities are just 1 to 2 years behind Phoenix.
The annual generation stated in Table 1does not reflect diurnal and seasonal variations in output. After all, the sun does not always shine, nor does the wind always blow. A combination of dispatchable generation, transmission networks, demand management programs and energy storage is required to balance the grid, including the variability of wind and solar generation. However, it is interesting to note that the wind and solar resources in Canada are quite complimentary:
- Geographically, the onshore wind resources are better at higher latitudes, while the solar resources are better in Southern Canada.[viii]
- In Southern Canada, Alberta and Saskatchewan offer the best onshore wind and solar resources.
- Offshore wind is available on the Pacific Coast (British Columbia), on the Atlantic Coast (Maritimes provinces and NF&L), on the Great Lakes (Ontario) and Lake Winnipeg (Manitoba).
- Hydroelectric potential is greatest in Québec and Manitoba.
- Across Canada, wind resources are, on average, better in the winter, while the solar resources are better in the summer. There is also some hourly complementarity between wind and solar potential.[ix]
References:
[i] Renewable Power Generation Costs in 2017, International Renewable Energy Agency, 2018, Figure 2.12, p. 50.
[ii] Renewable Power Generation Costs in 2017, International Renewable Energy Agency, 2018, p. 19-20.
[iii] http://www.investor.nexteraenergypartners.com/phoenix.zhtml?c=253465&p=earningsRelease, accessed 20180130.
[iv] https://www.aeso.ca/market/renewable-electricity-program/rep-round-1-results, accessed 20180128.
[v] U.S. Solar Photovoltaic System Cost Benchmark: Q1 2017, National Renewable energy laboratory, Figure ES-3.
[vi] http://pvwatts.nrel.gov/index.php, accessed 20180129, and author’s calculations.
[vii] Calgary is the sunniest of Canada’s largest cities and Edmonton is the third-sunniest. Perhaps surprisingly, Alberta enjoys a much better solar resource than Germany, an early leader in solar PV.
[viii] See the The Atlas of Canada – Clean Energy Resources and Projects (CERP), http://atlas.gc.ca/cerp-rpep/en/, accessed 20180129, for the wind and solar energy resource potential in Canada.
[ix] Energy Watch Group, Global Energy System Based on 100% Renewable Energy – Power Sector: Canada, Lappeenranta University of Technology, 2017, p. 5.