In over 35 years working in telecom and energy industries, including 20 in consulting, I have designed systems, financed them, sold them, manage multi-million implementation programs, and ran large service operations. Always a bit of a nerd, I am passionate about how digital technologies transform entire industries and I accompany my clients in this tortuous journey.
I graduated as a professional engineer and went on to complete a Master degree in Applied Sciences and an MBA.
President Trump’s energy strategy is reshaping North America’s economic and geopolitical landscape. Through tariffs, trade reviews, and Arctic ambitions, his administration seeks to secure U.S. energy dominance while pressuring Canada. With elections looming, Canada faces tough decisions on trade, infrastructure, and diplomacy in response to U.S. leverage.
President Donald Trump’s recent executive actions mark a significant shift in U.S. energy policy. Focused on securing energy dominance, his administration has turned to tariffs, trade negotiations, and strategic geopolitical moves, particularly in relation to Canada. With an 18-month window before the midterms, Trump is leveraging economic pressure to reshape North American energy relations and Arctic access.
Energy Emergency and Policy Shift
Trump’s declaration of an energy emergency underscores his administration’s concerns over the adequacy of U.S. energy infrastructure. The order defines energy broadly, including crude oil, natural gas, coal, uranium, biofuels, and rare earth minerals.
His “Unleashing American Energy” initiative cements U.S. ambitions to become a global leader in energy production and mineral processing, reducing reliance on foreign sources. Chris Wright, Secretary of Energy, has championed this policy, arguing that energy abundance is key to economic growth and global influence.
Why Canada Matters
Canada plays a crucial role in U.S. energy strategy for several reasons:
170 billion barrels of proven oil reserves, more than double that of the U.S.
Extensive hydroelectric power generation, particularly in Québec
Abundant uranium, lithium, and rare earth minerals
Strategic Arctic access, offering geopolitical leverage over Russia and China
With U.S. shale oil production expected to peak by 2028, securing Canadian resources has become even more critical.
Tariffs and Economic Leverage
On February 1st, Trump imposed a 25% tariff on Canadian goods but only 10% on energy, officially framed as a measure against illegal border crossings and fentanyl trafficking. However, varying tariff rates also serve broader strategic purposes:
Preventing immediate energy price hikes in the U.S. with a lower tariff rate on energy.
Pressuring Canada into trade concessions for manufactured products.
Driving a wedge between Alberta and the rest of Canada, as Alberta’s oil sector may push for closer U.S. ties
Trump acknowledged these motivations on February 2nd, stating:
“Canada has been very tough for oil and energy.”
Additionally, Trump’s April 1 trade review could further escalate economic pressure, particularly as Canada approaches elections.
Arctic Strategy and Military Interests
Beyond oil and minerals, Trump aims to secure U.S. dominance in the Arctic. Canada’s Arctic territories hold untapped energy reserves and emerging shipping lanes due to climate change.
Trump has expressed interest in acquiring Greenland, home to the U.S. Thule Air Base, as part of a broader strategy. Control over Alaska, Greenland, and Canada’s northern regions would provide the U.S. with a dominant geopolitical position in the Arctic. Establishing a military base in Canada’s High Arctic could further enhance U.S. influence over Arctic trade and security.
Trump’s 51st State Negotiation Tactic
On February 2nd, Trump suggested on Truth Social that Canada should become the 51st state. While unrealistic, this aligns with Trump’s extreme positioning strategy—an approach where he begins with radical demands before negotiating to achieve his actual objectives.
Rather than annexation, his real aim appears to be a trade and military arrangement that secures U.S. control over Canadian resources and Arctic access.
Canada’s Response and Counterstrategies
Despite U.S. pressure, Canada has options:
Respond with tariffs and non-tariff measures to affect US jobs, inflation and stock markets.
Expanding trade ties with Europe and Asia to reduce reliance on the U.S.
Developing an east-west energy corridor to strengthen domestic energy distribution.
Ensuring bipartisan opposition to U.S. tariffs, as all major Canadian parties currently reject concessions to Trump.
However, economic and trade pressures may test this political unity in the coming months.
Infrastructure and Energy Vulnerabilities
Canada’s energy infrastructure is deeply tied to the U.S., making it vulnerable to American policy shifts:
Pipelines like Keystone XL and Enbridge Line 5 remain subject to U.S. regulatory interference
Eastern Canada depends on U.S. energy imports, risking supply disruptions
Potential new tariffs or restrictions could force Canada to develop alternative export routes
Trump & Musk: A Shared Approach to Rule-Bending
Both Donald Trump and Elon Musk have a history of pushing regulatory boundaries to achieve their objectives. In The Art of the Deal, Trump advocates for taking extreme positions and conceding only when necessary. Similarly, Musk follows a “first-principles thinking” approach, often bypassing traditional regulations at Tesla and SpaceX.
Whether rolling back environmental laws, challenging trade norms, or disrupting global markets, both leaders prioritize disruption over compliance, a strategy now shaping U.S.-Canada relations.
Conclusion: A High-Stakes Energy Gamble
Trump’s energy strategy is a calculated geopolitical maneuver to dominate North American energy markets and secure Arctic influence. Whether it succeeds or falters under economic and political realities remains to be seen, but one thing is certain:
The battle for energy and Arctic dominance has begun.
Summary: History shows that isolation leads to stagnation, while openness fosters innovation. The Counter-Reformation of the 16th and 17th centuries stifled Catholic Europe’s progress, just as Trump’s policies on immigration, trade, and fossil fuels threaten U.S. leadership today. Canada, however, stands to benefit—attracting talent, investment, and advancing AI and green tech.
History consistently demonstrates that societies embracing openness, intellectual freedom, and collaboration thrive, while those turning inward risk stagnation. The Counter-Reformation of the 16th and 17th centuries saw Catholic Europe suppress dissent and restrict scientific progress, while Protestant nations fostered innovation and flourished. Today, the United States, under President Trump’s second term, is undergoing a similar inward turn—characterized by restrictive immigration policies, trade barriers (especially with Canada), and a renewed focus on fossil fuels. While some institutions resist this shift, these policies could weaken U.S. leadership in science, technology, and economic growth. Meanwhile, this crisis presents a unique opportunity for more open societies, such as Canada, to attract talent, investment, and technological leadership.
The Counter-Reformation and the Suppression of Scientific Innovation
The Counter-Reformation was the Catholic Church’s response to the Protestant Reformation, which originated in the Netherlands before spreading throughout Europe. In a bid to maintain control, the Church enforced strict censorship, persecuted dissenting intellectuals, and prioritized religious orthodoxy over free inquiry. As a result, once-prominent Catholic nations like Spain and Italy saw a decline in scientific contributions due to the rigid restrictions imposed by institutions like the Inquisition.
In contrast, Protestant nations such as the Netherlands and England embraced intellectual openness, paving the way for groundbreaking discoveries. Thinkers such as Johannes Kepler, Isaac Newton, and Robert Boyle flourished in these societies, pushing humanity forward in science, philosophy, and technology. The Counter-Reformation also slowed advancements in medicine by restricting human dissection and anatomical research, limiting medical knowledge in Catholic regions. Additionally, Catholic authorities censored and restricted the dissemination of scientific texts, hampering the spread of new ideas. The development of navigation, which relied on astronomical observations, was also affected by the resistance to heliocentric theories, delaying progress in exploration.
This divergence between Catholic and Protestant regions serves as a historical case study of how intellectual repression leads to stagnation, while openness fosters progress.
This historical lens is crucial in understanding the United States’ current trajectory under isolationist policies.
Trump’s Isolationism: Immigration and Trade Policies Closing Off the U.S.
Just as the Counter-Reformation stifled intellectual and economic advancement in Catholic Europe, President Trump’s policies in immigration and trade risk pushing the U.S. toward economic and technological insularity.
Immigration: The Loss of Global Talent
The U.S. has long been a magnet for the world’s brightest minds, fuelling its leadership in science, technology, and entrepreneurship. However, Trump’s immigration policies threaten this historic advantage:
Tightened Restrictions on High-Skilled Immigration: Increased visa backlogs, reduced work visa availability, and bureaucratic hurdles discourage top-tier professionals, redirecting them toward Canada and Europe.
Declining University Enrollment: A significant drop in international student applications weakens research institutions, which rely on foreign talent to maintain global competitiveness.
Although mass deportations primarily impact undocumented immigrants rather than high-skilled professionals, the broader anti-immigration stance deters global talent from considering the U.S. as an innovation hub. Much like how the Counter-Reformation drove intellectuals to Protestant regions, Trump’s immigration policies risk pushing top scientists, engineers, and entrepreneurs to more open societies. Countries like Canada, with proactive immigration policies, stand to benefit from this exodus of talent.
Trade: Economic Retrenchment and Damage to U.S.-Canada Relations
Trump’s economic nationalism mirrors the economic isolationism of Catholic Europe, which saw its global influence decline as Protestant nations expanded their trade networks.
Tariffs on Canada and Mexico: A 25% tariff on imports from Canada (10% on energy) and Mexico disrupts long-standing trade relationships and increases costs for consumers and businesses.
Weakening of the USMCA: While the United States-Mexico-Canada Agreement (USMCA) was intended to modernize NAFTA, recent tariff impositions undermine its stability and will trigger retaliatory measures.
“Buy American” Policies: These policies discourage supply chain integration with allies, making U.S. manufacturing less competitive globally.
Canada has responded by announcing 25% counter-tariffs on American goods, while leveraging its position as a major supplier of critical minerals—potentially shifting trade relationships toward Europe and Asia. As the U.S. isolates itself, Canada has a unique opportunity to expand its role in global trade networks and attract foreign investment.
Green and Climate Technologies: Losing Ground in the Race for the Future
Just as the Counter-Reformation rejected scientific advancements such as Galileo’s heliocentric model and medical discoveries, Trump’s rollback of forward-looking policies threatens U.S. leadership in emerging green technologies.
Return to Fossil Fuels: The administration has prioritized coal, oil, and natural gas over renewable energy, even as the rest of the world accelerates investment in clean energy.
Regulatory Rollbacks: Federal emissions regulations have been weakened, funding for renewable energy research slashed, and participation in international climate agreements reduced.
Global Competition: While the U.S. turns back to fossil fuels, China and, to a lesser extent, the European Union are dominating the global green energy sector, leading in electric vehicles, battery storage, hydrogen energy, and solar and wind power manufacturing.
The long-term risk is clear: if the U.S. continues to retreat from green innovation, it will lose its technological edge in industries that will define the future global economy—just as Catholic Europe lost its scientific edge to Protestant nations. However, Canada, with its commitment to renewable energy and environmental policies, has the potential to position itself as a leader in the transition to a green economy.
Institutional Resistance: Countering the Inward Turn
Despite Trump’s restrictive policies, several key institutions have resisted the U.S.’s inward shift, helping to preserve its role as an international leader in innovation and trade.
State Governments: Many states, particularly California, have maintained strong environmental and trade policies, signing independent agreements with global partners.
Tech and Business Leaders: Companies like Apple and Microsoft continue investing in international talent and supply chains, resisting protectionist policies.
Universities and Research Institutions: Top universities remain hubs for international collaboration, advocating for the continued influx of global talent.
International Partnerships: Canada and the EU can deepen ties with U.S. states and companies, ensuring that American innovation remains linked to global markets.
As these institutions push back against isolationist policies, they create openings for global strategic partnerships. This resistance highlights the possibility of maintaining and even strengthening economic and technological collaborations beyond the U.S. borders. Canada, in particular, stands to benefit by aligning with these forward-thinking entities, setting the stage for broader economic expansion and leadership in key industries.
Canada’s Opportunity for Economic Development
As the U.S. withdraws from global leadership in clean technology, trade, and green innovation, Canada can capitalize on this shift by taking proactive steps to drive economic growth:
Expanding Talent and Research Leadership: Canada can strengthen its position as a global innovation hub by expanding pathways for skilled workers, researchers, and entrepreneurs. Montréal and Toronto have become international AI powerhouses, attracting top-tier talent and investment in cutting-edge technology.
Strengthening Trade Networks and Supply Chains: By deepening economic ties with Europe, Asia, and other global partners, Canada can reduce reliance on the U.S. market. Strategic investments in critical supply chains—such as electrical equipment, battery technology, and artificial intelligence—will ensure long-term competitiveness in the evolving global economy.
Investing in Clean and Advanced Technologies: Increased government support for renewable energy, electric vehicle production, and sustainable infrastructure can position Canada as a leader in future industries. Building on AI-driven advancements, these sectors can drive sustainable economic growth and innovation.
Boosting Domestic Manufacturing and High-Value Industries: Strengthening Canada’s domestic manufacturing capabilities will help secure its role in high-value industries, ensuring economic resilience and positioning the country as a key player in the new global economy.
By embracing these opportunities, Canada can transform this crisis into a catalyst for long-term economic expansion, solidifying its role as a leader in trade, technology, and sustainability.
Conclusion: The Cost of Closing Off and the Opportunity for Others
Just as the Counter-Reformation stifled Catholic Europe’s intellectual and economic progress while Protestant nations thrived, Trump’s isolationist policies—particularly in immigration, trade, and emerging technologies—risk undermining U.S. leadership. However, institutional resistance within the U.S. suggests that, unlike Catholic Europe of the 16th and 17th centuries, the country may quickly recover from this inward turn if more open policies are reinstated in the future. Meanwhile, Canada and other open societies stand to gain from the U.S.’s retreat, attracting top talent, investment, and leadership in the industries of the future.
Résumé : L’histoire montre que l’isolement mène à la stagnation tandis que l’ouverture favorise l’innovation. La Contre-Réforme des XVIe et XVIIe siècles a étouffé les progrès de l’Europe catholique, tout comme les politiques de Trump sur l’immigration, le commerce et les combustibles fossiles menacent aujourd’hui le leadership américain. Le Canada a toutefois tout à gagner en attirant des talents, des investissements et en faisant progresser l’IA et les technologies vertes.
L’histoire démontre constamment que les sociétés qui adoptent l’ouverture, la liberté intellectuelle et la collaboration prospèrent, tandis que celles qui se replient sur elles-mêmes risquent la stagnation. La Contre-Réforme des XVIe et XVIIe siècles a vu l’Europe catholique réprimer la dissidence et restreindre le progrès scientifique, tandis que les nations protestantes ont encouragé l’innovation et prospéré. Aujourd’hui, les États-Unis, sous le deuxième mandat du président Trump, connaissent un repli sur soi similaire, caractérisé par des politiques d’immigration restrictives, des barrières commerciales (en particulier avec le Canada) et un regain d’intérêt pour les combustibles fossiles. Bien que certaines institutions résistent à ce changement, ces politiques pourraient affaiblir le leadership des États-Unis dans les domaines de la science, de la technologie et de la croissance économique. Entre-temps, cette crise offre une occasion unique aux sociétés plus ouvertes, comme le Canada, d’attirer des talents, des investissements et un leadership technologique.
La contre-réforme et la suppression de l’innovation scientifique
La Contre-Réforme était la réponse de l’Église catholique à la Réforme protestante, qui a pris naissance aux Pays-Bas avant de se répandre dans toute l’Europe. Dans le but de maintenir le contrôle, l’Église a imposé une censure stricte, persécuté les intellectuels dissidents et donné la priorité à l’orthodoxie religieuse plutôt qu’à la libre enquête. En conséquence, des nations catholiques autrefois importantes, comme l’Espagne et l’Italie, ont connu une baisse des contributions scientifiques en raison des restrictions rigides imposées par des institutions comme l’Inquisition.
En revanche, les nations protestantes, telles que les Pays-Bas et l’Angleterre, ont adopté l’ouverture intellectuelle, ouvrant la voie à des découvertes révolutionnaires. Des penseurs, tels que Johannes Kepler, Isaac Newton et Robert Boyle, ont prospéré dans ces sociétés, poussant l’humanité vers l’avant dans la science, la philosophie et la technologie. La Contre-Réforme a aussi ralenti les progrès de la médecine en limitant la dissection humaine et la recherche anatomique. Cela a limité les connaissances médicales dans les régions catholiques. De plus, les autorités catholiques ont censuré et restreint la diffusion de textes scientifiques, ce qui a entravé la diffusion de nouvelles idées. Le développement de la navigation, qui dépendait d’observations astronomiques, a aussi été freiné par la résistance aux théories héliocentriques, ce qui a entravé les progrès de l’exploration.
Cette divergence entre les régions catholiques et protestantes sert d’étude de cas historique sur la façon dont la répression intellectuelle conduit à la stagnation, tandis que l’ouverture favorise le progrès.
Cette lentille historique est cruciale pour comprendre la trajectoire actuelle des États-Unis dans le cadre de politiques isolationnistes.
Isolationnisme de Trump : les politiques d’immigration et de commerce ferment les États-Unis
Tout comme la Contre-Réforme a étouffé le progrès intellectuel et économique dans l’Europe catholique, les politiques du président Trump en matière d’immigration et de commerce risquent de pousser les États-Unis vers l’insularité économique et technologique.
L’immigration : la perte de talents mondiaux
Les États-Unis ont longtemps été un aimant pour les esprits les plus brillants du monde, alimentant leur leadership dans les sciences, la technologie et l’entrepreneuriat. Cependant, les politiques d’immigration de Trump menacent cet avantage historique :
· Restrictions renforcées sur l’immigration hautement qualifiée : L’augmentation des arriérés de visas, la réduction de la disponibilité des visas de travail et les obstacles bureaucratiques découragent les professionnels de haut niveau, les redirigeant vers le Canada et l’Europe.
· Baisse des inscriptions à l’université : Une baisse significative des demandes d’étudiants internationaux affaiblit les établissements de recherche, qui comptent sur les talents étrangers pour maintenir la compétitivité mondiale.
Bien que les expulsions massives touchent principalement les immigrants sans papiers plutôt que les professionnels hautement qualifiés, la position anti-immigration plus large dissuade les talents mondiaux de considérer les États-Unis comme un centre d’innovation. Tout comme la façon dont la Contre-Réforme a conduit les intellectuels dans les régions protestantes, les politiques d’immigration de Trump risquent de pousser les meilleurs scientifiques, ingénieurs et entrepreneurs vers des sociétés plus ouvertes. Des pays comme le Canada, dotés de politiques d’immigration proactives, profiteront de cet exode de talents.
Commerce : Compressions économiques et dommages aux relations entre les États-Unis et le Canada
Le nationalisme économique de Trump reflète l’isolationnisme économique de l’Europe catholique, qui a vu son influence mondiale décliner à mesure que les nations protestantes élargissant leurs réseaux commerciaux.
· Droits de douane sur le Canada et le Mexique : Un droit de douane de 25 % sur les importations en provenance du Canada (10 % sur l’énergie) et du Mexique perturbe les relations commerciales de longue date et augmente les coûts pour les consommateurs et les entreprises.
· Affaiblissement de l’AEUMC : Alors que l’Accord États-Unis-Mexique-Canada (AEUMC) visait à moderniser l’ALENA, les récentes impositions de droits de douane minent sa stabilité et déclencheront des mesures de rétorsion.
· Politiques «?Buy American?» : Ces politiques découragent l’intégration de la chaîne d’approvisionnement avec leurs alliés, ce qui rend le secteur manufacturier américain moins compétitif à l’échelle mondiale.
Le Canada a réagi en annonçant des contre-droits de douane de 25 % sur des produits américains, tout en tirant parti de sa position en tant que fournisseur important de minéraux essentiels, ce qui pourrait modifier les relations commerciales vers l’Europe et l’Asie. Alors que les États-Unis s’isolent, le Canada a une occasion unique d’élargir son rôle dans les réseaux commerciaux mondiaux et d’attirer les investissements étrangers.
Technologies vertes et climatiques : perdre du terrain dans la course à l’avenir
Tout comme la Contre-Réforme a rejeté les progrès scientifiques, tels que le modèle héliocentrique de Galilée et les découvertes médicales, le recul de Trump des politiques tournées vers l’avenir menace le leadership des États-Unis dans les technologies vertes émergentes.
· Retour aux combustibles fossiles : L’administration a donné la priorité au charbon, au pétrole et au gaz naturel plutôt qu’aux énergies renouvelables, alors même que le reste du monde accélère les investissements dans l’énergie propre.
· Reculs réglementaires : Les règlements fédéraux sur les émissions ont été affaiblis, le financement de la recherche sur les énergies renouvelables a été réduit et la participation aux accords internationaux sur le climat a diminué.
· Concurrence mondiale : Alors que les États-Unis reviennent aux combustibles fossiles, la Chine et, dans une moindre mesure, l’Union européenne dominent le secteur mondial de l’énergie verte, en tête dans les secteurs des véhicules électriques, du stockage de batteries, de l’énergie hydrogène et de la fabrication d’énergie solaire et éolienne.
Le risque à long terme est clair : si les États-Unis continuent de se retirer de l’innovation verte, ils perdront leur avantage technologique dans les industries qui définiront la future économie mondiale, tout comme l’Europe catholique a perdu son avantage scientifique au profit des nations protestantes. Cependant, le Canada, grâce à son engagement à l’égard des énergies renouvelables et des politiques environnementales, a le potentiel de se positionner comme un chef de file dans la transition vers une économie verte.
Résistance institutionnelle : contrer le virage vers l’intérieur
Malgré les politiques restrictives de Trump, plusieurs institutions clés ont résisté au repli d’intérieur des États-Unis, aidant à préserver leur rôle de leader international en matière d’innovation et de commerce.
· Gouvernements des États : De nombreux États, en particulier la Californie, ont maintenu des politiques environnementales et commerciales solides, signant des accords indépendants avec des partenaires mondiaux.
· Leaders technologiques et commerciaux : Des entreprises comme Apple et Microsoft continuent d’investir dans les talents et les chaînes d’approvisionnement internationaux, résistant aux politiques protectionnistes.
· Universités et instituts de recherche : Les meilleures universités demeurent des plaques tournantes de la collaboration internationale, plaidant pour l’afflux continu de talents mondiaux.
· Collaborations internationales : Le Canada et l’Union européenne peuvent renforcer leurs liens avec les États-Unis et les entreprises, s’assurant que l’innovation américaine reste ancrée sur les marchés mondiaux.
Alors que ces institutions s’opposent aux politiques isolationnistes, elles créent des ouvertures pour des partenariats stratégiques mondiaux. Cette résistance met en évidence la possibilité de maintenir et même de renforcer les collaborations économiques et technologiques au-delà des frontières américaines. Le Canada, en particulier, a tout à gagner à s’aligner sur ces entités avant-gardistes, préparant ainsi le terrain pour une expansion économique et un leadership plus larges dans des industries clés.
Les possibilités de développement économique du Canada
Alors que les États-Unis se retirent du leadership mondial en matière de technologie propres, de commerce et d’innovation verte, le Canada peut tirer parti de ce changement en prenant des mesures proactives pour stimuler la croissance économique :
· Accroître le talent et le leadership en recherche : Le Canada peut renforcer sa position en tant que centre d’innovation mondial en élargissant les voies pour les travailleurs qualifiés, les chercheurs et les entrepreneurs. Montréal et Toronto, en particulier, sont devenues des puissances internationales de l’IA, attirant des talents de haut niveau et des investissements dans la technologie de pointe.
· Renforcement des réseaux commerciaux et des chaînes d’approvisionnement : En approfondissant les liens économiques avec l’Europe, l’Asie et d’autres partenaires mondiaux, le Canada peut réduire sa dépendance à l’égard du marché américain. Les investissements stratégiques dans les chaînes d’approvisionnement essentielles, comme l’équipement électrique, la technologie des batteries et l’intelligence artificielle, assureront la compétitivité à long terme de l’économie mondiale en évolution.
· Investir dans les technologies propres et de pointe : Un soutien gouvernemental accru à l’énergie renouvelable, à la production de véhicules électriques et à l’infrastructure durable peut positionner le Canada comme un chef de file dans les industries futures. En s’appuyant sur les progrès réalisés par l’IA, ces secteurs peuvent stimuler une croissance économique et une innovation durables.
· Stimuler la fabrication nationale et les industries de grande valeur : Le renforcement des capacités de fabrication nationales du Canada aidera à renforcer son rôle dans les industries de grande valeur, à assurer la résilience économique et à positionner le pays comme un acteur clé de la nouvelle économie mondiale.
En saisissant ces possibilités, le Canada peut transformer cette crise en un catalyseur d’expansion économique à long terme, renforçant ainsi son rôle de chef de file en matière de commerce, de technologie et de durabilité.
Conclusion : Le coût de la fermeture et l’occasion pour les autres
Tout comme la Contre-Réforme a étouffé le progrès intellectuel et économique de l’Europe catholique tandis que les nations protestantes prospéraient, les politiques isolationnistes de Trump — en particulier dans l’immigration, le commerce et les technologies émergentes — risquent de saper le leadership américain. Cependant, la résistance institutionnelle au sein des États-Unis suggère que, contrairement à l’Europe catholique XVIe et XVIIe siècles, le pays pourrait rapidement se remettre de ce virage intérieur si des politiques plus ouvertes sont rétablies à l’avenir. Pendant ce temps, le Canada et d’autres sociétés ouvertes ont tout à gagner du recul des États-Unis, attirant les meilleurs talents, les investissements et le leadership dans les industries de l’avenir.
Comment un comportement vert peut en influencer un autre
Les recherches montrent que s’engager dans une initiative verte, comme le recyclage ou l’achat d’un véhicule électrique (VE), peut entraîner des effets positifs ou négatifs :
Effet positif : Adopter une action écologique peut renforcer une identité environnementale, incitant les individus à adopter d’autres pratiques durables. Par exemple, quelqu’un qui a l’habitude de recycler pourrait être motivé à commencer à composter ou à réduire le gaspillage alimentaire.
Effet négatif : À l’inverse, adopter une action écologique peut entraîner une forme de «?relâchement moral?», où l’on se sent dispensé de poursuivre d’autres efforts. Une personne qui achète un VE pourrait, par exemple, justifier des actions moins durables, comme multiplier les vols longue distance.
Ce que cela signifie pour les gouvernements, les services publics et les entreprises
Pour promouvoir la durabilité, il est essentiel de comprendre la dynamique des effets d’entraînement. Bien que la volonté individuelle et les petites actions soient importantes, elles ne suffisent pas à elles seules pour provoquer les changements à grande échelle nécessaires pour relever les défis environnementaux. Des mesures réglementaires doivent jouer un rôle central pour limiter les actions non durables et instaurer une responsabilité systémique.
Stratégies clés pour un changement systémique :
Établir des normes réglementaires complètes. Mettre en place des politiques strictes qui imposent des pratiques durables dans tous les secteurs, comme des normes d’efficacité énergétique, des protocoles de gestion des déchets et des exigences en matière de recyclage. Ces règlements garantissent que les actions individuelles contribuent de manière significative aux objectifs globaux.
Intégrer des mécanismes de responsabilisation. Développer des cadres pour faire respecter les politiques environnementales, en tenant les individus et les industries responsables de leur impact. Par exemple, instaurer des sanctions pour non-respect du compostage ou interdire les plastiques à usage unique.
Faciliter l’accessibilité systémique. Mettre en œuvre des mesures qui rendent les choix durables obligatoires, comme le compostage en bordure de rue et la responsabilité des producteurs en matière de déchets. Les subventions et les incitations devraient être liées à des résultats environnementaux mesurables.
Exploiter les normes sociales et la fierté collective. S’appuyer sur la fierté communautaire et l’identité collective en fixant des objectifs ambitieux et applicables pour la réduction des déchets et la conservation de l’énergie. Mettre en avant le leadership local tout en assurant l’adhésion par un soutien structurel.
En mettant l’accent sur le changement systémique par le biais de la réglementation, les gouvernements, les services publics et les entreprises peuvent surmonter les limites des actions à petite échelle et des efforts individuels, réalisant ainsi des progrès significatifs vers la durabilité.
La position unique du Québec : opportunités et défis
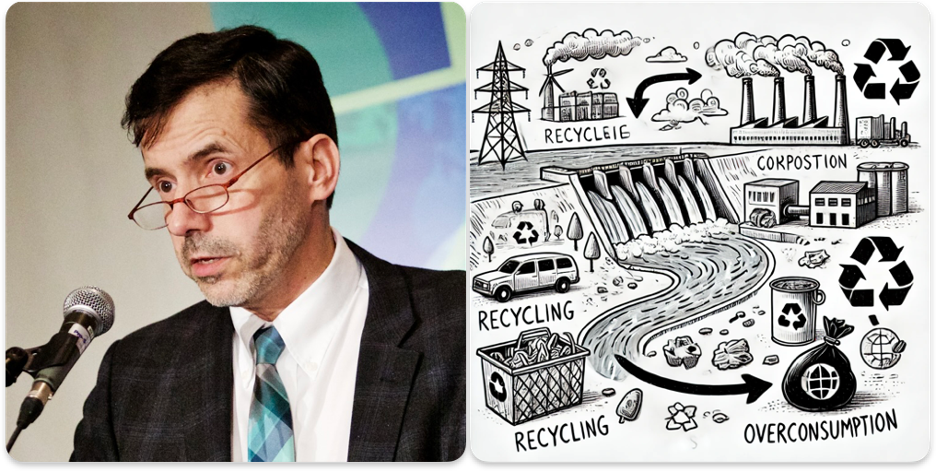
Le réseau électrique vert d’Hydro-Québec, principalement alimenté par l’hydroélectricité, place la province parmi les leaders mondiaux de l’énergie propre. Cependant, ce succès s’accompagne de défis comportementaux, notamment des effets d’entraînement négatifs dans des domaines comme le recyclage et le compostage.
Voici des leçons adaptées au Québec :
Encadrer l’hydroélectricité comme un point de départ, et non une finalité : Les campagnes devraient souligner que l’électricité propre n’est que le début de la durabilité. Par exemple, un message comme «?L’hydroélectricité combat les changements climatiques. Agissons maintenant sur les déchets et la biodiversité?» peut inspirer des actions complémentaires.
Prévenir la surconsommation et le gaspillage par la réglementation. L’abondance d’énergie propre peut entraîner des comportements de gaspillage. Les politiques qui imposent l’efficacité énergétique (par exemple, la rénovation des bâtiments) et limitent la consommation inutile peuvent contrer cette tendance.
Promouvoir des actions complémentaires grâce à des mandats. Mettre en place des programmes obligatoires de compostage, de recyclage avancé et de réduction des plastiques pour garantir que tous les résidents contribuent aux objectifs de durabilité.
Exploiter la fierté locale avec un soutien politique : Les Québécois sont fiers de leur leadership environnemental. Les règlements qui renforcent ce leadership, comme des cibles strictes de réduction des déchets, peuvent transformer cette fierté en action.
Pour aller plus loin
Positive and Negative Spillovers in Pro-Environmental Behaviours
Nature Sustainability: Méta-analyse des effets d’entraînement.Lire ici
Moral Licensing and the Risks of Monetary Incentives
Frontiers in Psychology : Étude sur l’impact des motivations financières sur l’identité écologique.Lire ici
Behavioural Consistency in Green Lifestyle and Investment
Analyse des liens entre habitudes écologiques et décisions financières.Lire ici
Research has shown that engaging in one green initiative, such as recycling or switching to an electric vehicle (EV), can lead to positive spillovers or negative spillovers:
Positive Spillover: Taking a green action can reinforce an environmental self-identity, motivating individuals to adopt additional sustainable practices. For example, someone who regularly recycles might be inspired to compost or reduce food waste.
Negative Spillover: Conversely, engaging in one green action can lead to moral licensing, where individuals feel they’ve “done their part” and reduce efforts in other areas. A person who buys an EV, for instance, might justify less sustainable actions like taking frequent long-haul flights.
What This Means for Governments, Utilities, and Companies
For organizations promoting sustainability, understanding spillover dynamics is crucial. While individual willingness and small-scale actions are important, they alone are insufficient to drive the large-scale changes needed to tackle environmental challenges. Regulatory measures must play a central role in constraining unsustainable actions and creating systemic accountability.
Key Strategies for Systemic Change:
Set Comprehensive Regulatory Standards: Establish strict policies that mandate sustainable practices across sectors, such as energy efficiency standards, waste management protocols, and recycling requirements. These regulations ensure individual actions contribute meaningfully to broader goals.
Integrate Accountability Mechanisms: Develop frameworks to enforce compliance with environmental policies, holding individuals and industries responsible for their impact. Examples include penalties for non-compliance with composting or bans on single-use plastics.
Support Systemic Accessibility: Implement measures that make sustainable choices the default, such as mandatory curbside composting and producer responsibility for waste. Subsidies and incentives should be tied to measurable environmental outcomes.
Leverage Social Norms and Pride: Build on community pride and collective identity by setting ambitious and enforceable targets for waste diversion and energy conservation. Showcase local leadership while ensuring adherence through structural support.
By emphasizing systemic change through regulation, governments, utilities, and companies can overcome the limitations of small-scale actions and individual efforts, driving significant progress toward sustainability.
Québec’s Unique Position: Opportunities and Challenges
Hydro-Québec’s green electricity grid, powered predominantly by hydroelectricity, places it among the global leaders in clean energy. However, this success comes with its own behavioural challenges, including potential negative spillovers in areas like recycling and composting.
Here are tailored lessons for Québec:
Frame Hydro as a Starting Point, Not the Endpoint: Campaigns should emphasize that clean electricity is just the beginning of sustainability. For example, messages like “Hydropower helps fight climate change—now let’s tackle waste and protect biodiversity” can inspire complementary actions.
Prevent Overconsumption and Waste Through Regulation: Clean energy abundance can lead to wasteful behaviours. Policies that enforce energy efficiency (e.g. building retrofits) and limit unnecessary consumption can counteract this tendency.
Promote Complementary Actions Through Mandates: Enforce mandatory composting, advanced recycling, and plastic reduction programs to ensure that all residents contribute to broader sustainability goals.
Leverage Local Pride with Policy Support: Québecers take pride in their environmental leadership. Regulations that reinforce this leadership, such as stringent waste diversion targets, can turn pride into action.
For Further Reading
Positive and Negative Spillovers in Pro-Environmental Behaviours
Nature Sustainability: Meta-analysis of spillover effects in pro-environmental behaviours. Read here
Moral Licensing and the Risks of Monetary Incentives
Frontiers in Psychology: How financial framing of green actions can weaken environmental identity. Read here
Behavioural Consistency in Green Lifestyle and Investment
Examines how sustainable habits align with financial behaviours. Read here
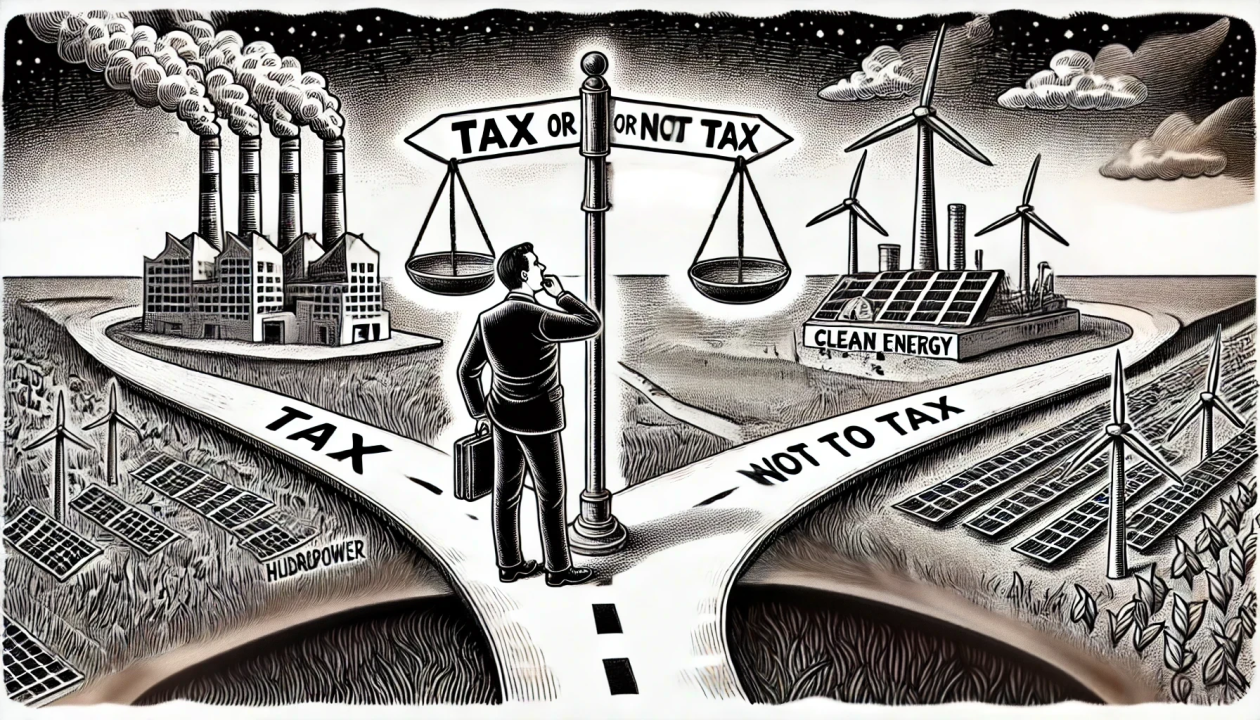
La taxe sur le carbone est devenue un point central dans le débat électoral fédéral au Canada, reflétant le défi de concilier croissance économique, durabilité environnementale et soutien public. En tant qu’outil largement discuté pour réduire les émissions de gaz à effet de serre, elle met en lumière la tension entre l’urgence de l’action climatique et les impacts économiques et sociaux des décisions politiques. Bien que la tarification du carbone soit importante, s’appuyer uniquement sur les signaux de prix est insuffisant pour parvenir à une transformation durable. Des comparaisons avec la transition des voitures à chevaux aux automobiles montrent qu’un succès dépend de l’innovation, mais aussi d’efforts concertés en vue d’établir des réglementations et des infrastructures, et non pas simplement d’une taxe sur le fumier.
Les objectifs des outils de politique carbone
L’objectif ultime des politiques carbone devrait être de réduire, voire d’éliminer durablement, les émissions mondiales de gaz à effet de serre. Pour y parvenir, il est nécessaire de déployer des outils stratégiques au fur et à mesure de l’évolution des technologies et des profils d’émissions. Cependant, des politiques axées sur l’efficacité à court terme risquent d’améliorer les systèmes d’énergies fossiles au lieu de promouvoir des alternatives zéro émission. Par exemple, des subventions visant à améliorer l’efficacité des centrales électriques au charbon pourraient réduire temporairement les émissions, mais prolonger la durée de vie de ces centrales, retardant ainsi les investissements dans les énergies renouvelables et augmentant les coûts à long terme.
Une stratégie plus efficace donne la priorité à un investissement précoce dans les technologies zéro émission, garantissant qu’elles peuvent être mises à l’échelle et devenir rentables avec le temps. La transition vers des systèmes propres dès que possible minimise le gaspillage de ressources et accélère la décarbonisation. Trouver cet équilibre est crucial : les politiques doivent éviter les perturbations économiques tout en obtenant un large soutien du public et des industries pour un changement transformateur.
Éviter les conséquences non intentionnelles
Les politiques carbone doivent prendre en compte les émissions mondiales en évitant les scénarios où les efforts nationaux déplacent les émissions en externalisant la production vers des régions avec des réglementations environnementales plus laxistes, sapant ainsi leur impact. Par exemple, l’externalisation de la production vers des pays comme la Chine, où le charbon domine le mix énergétique, a été associée à une augmentation des émissions mondiales malgré les réductions dans les pays occidentaux.
Les politiques doivent également minimiser les réactions négatives du public. Les taxes très visibles, par exemple celles imposées sur le carburant, peuvent être injustes envers les personnes qui n’ont pas accès à des options plus vertes. À la place, il serait préférable d’instaurer des subventions pour l’achat de voitures électriques ainsi que des amendes pour les voitures polluantes, lorsque des solutions alternatives existent, afin de promouvoir l’équité. De plus, les politiques doivent éviter la fermeture d’industries lorsque des alternatives durables ne sont pas encore développées, garantissant ainsi la résilience économique pendant la transition.
Innovation et changement structurel
La décarbonisation nécessite de l’innovation et des changements structurels, et pas seulement une redistribution des ressources. Un financement précoce de la recherche et du développement (R&D) public est essentiel pour créer et adopter de nouvelles technologies, qui peuvent ensuite être soutenues par des politiques de structuration du marché. Celles-ci incluent des subventions, des crédits d’impôt, des marchés publics, des mandats, des normes, des investissements publics directs et la tarification du carbone. Ces mesures établissent une base pour que les technologies propres gagnent en traction et dominent éventuellement le marché.
Les efforts devraient initialement se concentrer sur la promotion des industries renouvelables plutôt que de pénaliser l’utilisation des combustibles fossiles. Critiquer les systèmes existants sans présenter d’alternatives convaincantes n’aboutit à rien. À la place, mettre en avant et tester de nouvelles technologies propres dans des marchés de niche peut ouvrir la voie à une adoption plus large. Un soutien précoce, tel que des subventions et des crédits d’impôt, est crucial pour réduire les risques financiers qui dissuadent les investissements privés.
Le rôle de la tarification du carbone
La tarification du carbone est un outil polyvalent pour réduire les émissions, mais son efficacité dépend d’une conception et d’une mise en œuvre minutieuses. Au début de la transition, une tarification modérée du carbone pourrait ne pas encourager largement l’adoption de technologies vertes en raison de l’absence de substituts viables. Au lieu de cela, cette tarification peut conduire à des améliorations incrémentales de l’efficacité des combustibles fossiles ou à des déplacements sectoriels des émissions sans provoquer de changement structurel. Par exemple, une taxe carbone modeste pourrait encourager un passage du pétrole au gaz plutôt qu’aux énergies renouvelables.
Les systèmes de plafonnement et d’échange offrent une certitude quant à la réduction des émissions, mais introduisent une volatilité des prix, ce qui complique la planification à long terme pour les entreprises et les consommateurs. Cependant, ils présentent un avantage dans la collaboration interjuridictionnelle. Le système Québec-Californie illustre cette approche, harmonisant les objectifs régionaux et réduisant les émissions grâce à des cadres partagés.
À l’inverse, les taxes sur le carbone offrent une prévisibilité des coûts, favorisant les investissements dans des alternatives plus propres. Elles peuvent être plus facilement adaptées pour cibler les secteurs disposant d’options écologiques accessibles, comme la production d’électricité, tout en offrant des exemptions ou des taux réduits pour les industries difficiles à décarboner, telles que l’aviation ou la production de ciment. Cette flexibilité garantit l’équité et la praticabilité tout en encourageant l’innovation dans les technologies à faible émission.
En fin de compte, le choix entre les taxes sur le carbone et les systèmes de plafonnement et d’échange devrait refléter la préparation des secteurs et les objectifs régionaux, équilibrant les priorités environnementales, économiques et sociales.
Exploiter les politiques de structuration du marché tout au long du cycle de vie technologique
Les politiques de structuration du marché sont essentielles pour encourager l’adoption des technologies propres. Les différentes industries progressent à des rythmes distincts dans le développement technologique, nécessitant des approches ciblées. Les décideurs doivent reconnaître que plusieurs cycles de vie peuvent coexister simultanément dans différents secteurs :
Étape précoce : Le financement public de la R&D pose les bases de l’innovation. Les laboratoires de recherche jouent un rôle clé en effectuant des R&D essentielles et en testant de nouvelles technologies avant qu’elles ne soient déployées à plus grande échelle.
Étape de démonstration et de début de commercialisation : Les subventions et crédits d’impôt réduisent les risques financiers, permettant le déploiement initial de technologies propres. Les marchés publics accélèrent les projets de démonstration, prouvant la viabilité de ces solutions.
Étape de croissance : Les mandats et les normes aident à établir des marchés pour les technologies émergentes, tandis que les banques vertes et les financements ciblés comblent les lacunes de financement. Les décideurs doivent équilibrer l’intégration des chaînes d’approvisionnement mondiales avec le développement des capacités locales pour les composants critiques, garantissant la résilience économique. Cette approche double crée non seulement des emplois, mais renforce également le soutien public en montrant les avantages tangibles de la transition.
Étape de concurrence sur le marché : À mesure que la concurrence s’intensifie et que les économies d’échelle réduisent les coûts, des incitatifs déclinants peuvent encore combler les écarts de coûts, rendant les technologies propres plus abordables. Ces politiques facilitent une transition plus fluide pour les entreprises et les consommateurs vers des alternatives plus propres, réduisant les barrières financières et accélérant l’adoption généralisée.
Étape mature : Les pénalités financières, telles que les frais sur les technologies traditionnelles ou la tarification du carbone, deviennent des incitations efficaces pour abandonner les technologies obsolètes et polluantes. À ce stade, les alternatives propres sont largement disponibles et compétitives, faisant des pénalités un moteur solide pour finaliser la transition.
Séquencement et maintien du soutien politique
Un séquencement efficace des politiques est essentiel pour atteindre des réductions d’émissions durables tout en minimisant les perturbations économiques et la résistance publique. Les mesures précoces, telles que les marchés publics, les subventions et les réglementations sont fondamentales pour établir de nouvelles technologies. Cependant, un retrait prématuré du soutien risque de permettre aux industries établies de reprendre leur domination.
Une fois que les alternatives propres sont largement disponibles et compétitives, des pénalités ciblées sur les technologies obsolètes peuvent renforcer davantage la transition. La prévisibilité des politiques demeure cruciale, y compris en amont de leur application, ce qui permet aux parties prenantes d’avoir confiance pour planifier et investir dans des transitions à long terme. Les décideurs doivent également planifier l’offre d’électricité propre pour la demande croissante, garantissant que les infrastructures suivent le rythme des besoins en électrification. Cet alignement permet d’éviter les goulets d’étranglement qui pourraient ralentir l’effort global de décarbonisation.
Plan intégré du système énergétique (PISE)
Un PISE est crucial pour des solutions énergétiques durables. Contrairement à des mesures politiques isolées, un PISE adopte une approche globale de la gestion de l’énergie, intégrant diverses sources d’énergie, des prévisions de demande, des technologies, des infrastructures et des chaînes d’approvisionnement pour optimiser l’efficacité et la durabilité. Ce plan répond au besoin immédiat de réduire les émissions de gaz à effet de serre tout en garantissant la sécurité énergétique et la résilience économique à long terme.
Un PISE organise et intègre les efforts dans des secteurs clés, tels que l’électricité, les transports et l’industrie. En intégrant les progrès réalisés dans les énergies renouvelables, le stockage d’énergie, les technologies des réseaux intelligents et les solutions client décarbonées, un PISE vise à optimiser l’offre et la demande, réduire les inefficacités et améliorer la fiabilité du système. Cette approche est conçue pour soutenir la transition vers une économie à faible émission de carbone tout en répondant aux défis liés à la sécurité énergétique et à la durabilité.
Conclusion
La question de taxer ou de ne pas taxer illustre le défi plus large de la prise de décision en situation d’incertitude. Les décideurs doivent évaluer les risques, considérer les conséquences et aborder les préoccupations éthiques et pratiques pour tracer une voie à suivre. À l’image du dilemme existentiel d’Hamlet, «?être ou ne pas être?», les choix en matière de politique carbone sont empreints de complexité et d’enjeux d’une grande importance. Pour accélérer la transition énergétique, les gouvernements doivent utiliser une boîte à outils variée et dynamique, en séquençant et en calibrant soigneusement des politiques prévisibles afin de favoriser l’innovation, réduire les émissions et atteindre les objectifs climatiques mondiaux. La lutte pour décider reflète le besoin plus large de courage et de prévoyance face aux incertitudes de notre avenir commun.
The carbon tax has become a focal point in Canada’s federal election debate, reflecting the challenge of balancing economic growth, environmental sustainability, and public support. As a widely discussed tool for reducing greenhouse gas emissions, it highlights the tension between urgent climate action and the economic and social impacts of policy decisions. While carbon pricing is important, relying solely on price signals is insufficient for achieving a sustainable transformation. Comparisons to the transition from horse-drawn carriages to automobiles illustrate that success requires innovation alongside coordinated efforts to establish regulations and infrastructure—not just a tax on horse manure.
The Objectives of Carbon Policy ToolsThe ultimate goal of carbon policy should be to permanently reduce, or even eliminate, global greenhouse gas emissions. Achieving this requires strategic deployment of tools as technologies evolve and emission profiles shift. However, policies focused on short-term cost efficiency risk improving fossil fuel systems instead of promoting zero-emission alternatives. For instance, subsidies for enhancing the efficiency of coal-fired power plants might reduce emissions temporarily but extend the plants’ lifespans, delaying renewable energy investments and increasing long-term costs.A more effective strategy prioritizes early investment in zero-emission technologies, ensuring they can scale up and become cost-effective over time. Transitioning to clean systems as quickly as feasible minimizes wasted resources and accelerates decarbonization. Striking this balance is crucial: policies must avoid economic disruption while building broad public and industry support for transformative change.Avoiding Unintended ConsequencesCarbon policies must consider global emissions, avoiding scenarios where domestic efforts shift emissions by outsourcing manufacturing to regions with looser environmental regulations, thereby undermining their impact. For example, the outsourcing of production to countries like China, where coal dominates the energy mix, has been linked to a rise in global emissions despite reductions in Western nations.Policies should also mitigate public backlash. Overly apparent taxes, like fuel surcharges, can unfairly burden individuals without access to sustainable options. Instead, subsidies for eco-friendly vehicles and penalties for polluting ones, when viable alternatives exist, promote fairness. Additionally, policies must avoid shutting down industries where sustainable alternatives have not yet been developed, ensuring economic resilience during the transition.Innovation and Structural ChangeDecarbonization requires innovation and structural changes, not just redistribution of resources. Early funding of public research and development (R&D) is critical for creating and adopting new technologies, which can then be supported through market-shaping policies. These include subsidies, tax credits, public procurement, mandates, standards, direct public investment, and carbon pricing. Such measures establish a foundation for clean technologies to gain traction and eventually dominate the market.Efforts should initially focus on nurturing renewable industries rather than penalizing fossil fuel use. Criticizing existing systems without presenting compelling alternatives achieves little. Instead, showcasing and testing new clean technologies in niche markets can pave the way for broader adoption. Early-stage support, such as subsidies and tax credits, is crucial to address financial risks that deter private investment.The Role of Carbon PricingCarbon pricing is a versatile tool for reducing emissions, but its effectiveness depends on careful design and implementation. Early in the transition, moderate carbon prices may not drive widespread adoption of green technologies due to the lack of viable substitutes. Instead, they may lead to incremental efficiency improvements in fossil fuel use or emissions shifts across sectors without creating structural change. For example, a modest carbon tax might incentivize a shift from oil to gas rather than to renewables.Cap-and-trade systems provide certainty in emissions reductions but introduce price volatility, complicating long-term planning for businesses and consumers. However, they offer an advantage in cross-jurisdictional collaboration. The Québec-California system exemplifies this approach, harmonizing regional goals and achieving emissions reductions through shared frameworks.In contrast, carbon taxes offer cost predictability, fostering investments in cleaner alternatives. They can be more easily tailored to target sectors with accessible green options, like power generation, while offering exemptions or lower rates for hard-to-abate industries such as aviation or cement production. This flexibility ensures fairness and practicality while encouraging innovation in low-emission technologies.Ultimately, the choice between carbon taxes and cap-and-trade systems should reflect sector readiness and regional goals, striking a balance between environmental, economic, and social priorities.Leveraging Market-Shaping Policies Across the Technology Life CycleMarket-shaping policies are essential for driving the adoption of clean technologies. Different industries progress through distinct stages of technological development, requiring targeted approaches. Policymakers must acknowledge that several life cycles can coexist simultaneously within different sectors:
Early Stage: Public funding for R&D lays the foundation for innovation. Research laboratories play a key role in conducting essential R&D and testing new technologies before they are scaled for broader use.Demonstration and Early Commercial Stage: Subsidies and tax credits offset financial risks, enabling the initial deployment of clean technologies. Public procurement accelerates demonstration projects, proving the viability of these solutions.Growth Stage: Mandates and standards help establish markets for emerging technologies, while green banks and targeted lending address funding gaps. Policymakers must balance the integration of global supply chains with fostering local capacity for critical components, ensuring economic resilience. This dual approach not only creates jobs but also builds public support by showcasing tangible benefits of the transition.Market Competition Stage: As competition intensifies and economies of scale drive costs down, declining incentives can still bridge cost gaps, making clean technologies more affordable. These policies facilitate a smoother transition for businesses and consumers to adopt cleaner alternatives, reducing financial barriers and accelerating widespread adoption.Mature Stage: Financial penalties, such as fees on traditional technology or carbon pricing, become effective motivators for transitioning away from outdated and polluting technologies. By this stage, clean alternatives are widely available and cost-competitive, making penalties a strong driver for finalizing the transition.
Sequencing and Sustaining Policy SupportEffective policy sequencing is vital for achieving lasting emissions reductions while minimizing economic disruptions and public resistance. Early-stage measures such as public procurement, subsidies, and regulations are instrumental in establishing new technologies. However, withdrawing support prematurely risks allowing entrenched industries to reassert dominance.Once clean alternatives are widely available and competitive, targeted penalties on outdated technologies can further drive the transition. Policy predictability remains crucial, including well before their application, giving stakeholders the confidence to plan and invest in long-term transitions. Policymakers must also plan a clean electricity supply for the growing demand, ensuring that infrastructure keeps pace with electrification needs. This alignment helps avoid bottlenecks that could stall the broader decarbonization effort.Integrated Energy System Plan (IESP)An IESP is pivotal for sustainable energy solutions. Unlike isolated policy measures, an IESP takes a comprehensive approach to energy management, integrating diverse energy sources, demand forecasts, technologies, infrastructure, and supply chains to optimize efficiency and sustainability. This plan addresses the immediate need for reducing greenhouse gas emissions while ensuring long-term energy security and economic resilience.An IESP organizes and integrates efforts across key sectors, such as electricity, transportation, and industry. By incorporating advancements in renewable energy, energy storage, smart grid technologies, and green customer solutions, an IESP aims to optimize supply and demand, reduce inefficiencies, and improve system reliability. This approach is designed to support the transition to a low-carbon economy while addressing energy security and sustainability challenges.ConclusionThe question of whether to tax or not to tax encapsulates the broader challenge of decision-making under uncertainty. Policymakers must weigh risks, consider consequences, and grapple with ethical and practical concerns in charting a path forward. Like Hamlet’s existential dilemma, “to be or not to be”, the choices in carbon policy are fraught with complexity and stakes of great magnitude. To accelerate the energy transition, governments must employ a diverse and dynamic toolkit, carefully sequencing and calibrating predictable policies to foster innovation, reduce emissions, and achieve global climate goals. The struggle to decide reflects the broader need for courage and foresight in confronting the uncertainties of our shared future.
The “America First” trade policy and executive orders recently signed by President Trump present significant challenges for Canada’s energy sector, particularly for Québec. These measures include proposed tariffs on Canadian goods, a divergence in climate policies, and the rollback of electric vehicle (EV) incentives in the U.S. Given the deep integration of the North American auto and energy sectors, these developments have far-reaching implications for Canada’s energy transition.
The U.S. has proposed a 25% tariff on Canadian goods, including energy exports like oil, natural gas, and hydroelectricity. Québec’s hydroelectric sector, which relies heavily on electricity exports to the U.S., would be directly affected. Such tariffs would undermine Hydro Québec’s competitiveness for long-term contracts and its ability to trade on short-term spot markets in the U.S. Northeast. Canadian oil, already trading at a discount, would face further price pressure, exacerbating financial challenges for oil-producing provinces. This situation also raises questions about the viability of the Keystone XL pipeline, which was promoted by President Trump but may be rendered unnecessary if tariffs further reduce the competitiveness of Canadian oil. This contradiction adds to the uncertainty of future energy investments.
2. Reduced EV Availability
The rollback of U.S. EV incentives and infrastructure programs could hinder the growth of Canada’s EV supply chain. The integration of the North American auto sector means U.S. policies directly influence Canadian markets. A decrease in EV availability in the U.S. could similarly limit their availability in Canada, hindering the adoption of clean transportation technologies and delaying progress toward national emissions reduction targets.
3. Trade Restrictions and Supply Chain Risks
Potential U.S. trade restrictions on imports from countries like China or export controls on critical technologies could delay Canada’s energy transition. Key technologies at risk include:
Artificial Intelligence (AI): Vital for optimizing energy systems, enabling smart grids, and improving energy efficiency across sectors.
Energy storage systems: Batteries are essential for renewable energy integration, ensuring grid stability and balancing supply and demand. Advanced systems like lithium-ion and solid-state technologies play a critical role in renewable energy adoption and electric vehicles.
Grid management software: Necessary for modernizing energy infrastructure.
Solar and wind components: Turbines, panels, and related systems.
Transmission and distribution grid equipment: Critical for efficient electricity transmission and grid reliability, particularly with the integration of renewable energy. Transformers are currently in short supply, while DC transmission systems (HVDC) are an expanding market.
If Canada mirrors U.S. restrictions, it could face higher costs and limited access to these critical technologies.
Strategic Responses
Strengthening Domestic Supply Chains
Canada has a much smaller economy than the U.S., the EU, or China. It cannot realistically build supply chains for all components of the energy sector. Governments must focus on critical segments or areas where Canada has a competitive advantage. Key strategies include:
Re-shoring Manufacturing: Establishing domestic production for segments such as EV batteries, wind turbine components, and transformers to reduce reliance on foreign imports.
Trade Diversification: Expanding partnerships with Europe, South Korea, and Japan to secure access to essential materials and technologies.
Critical Material Access: Investing in domestic mining and recycling of rare earth elements and other vital materials.
Public-Private Partnerships: Supporting innovation and local manufacturing through subsidies and targeted investments.
Examples of focus areas include:
Critical Minerals: Leveraging Canada’s abundant reserves of lithium, nickel, and cobalt to support battery manufacturing.
Hydroelectric Power and Energy Storage: Capitalizing on Québec’s hydroelectric capacity, with east-west integration, and integrating advanced energy storage systems.
Renewable Hydrogen Production: Using renewable energy to produce green hydrogen for industrial decarbonization, particularly in sectors like steel and chemicals.
Prioritizing Local Energy Use
Québec’s abundant hydroelectric resources present an opportunity to focus on local decarbonization rather than exports. Electrification of transportation, heating, and heavy industry within Québec could reduce emissions while insulating the province from volatile export markets.
Similarly, while Canada’s oil and gas sectors warrant support in the near term, governments must balance investments against long-term trends. The International Energy Agency (IEA) predicts a global decline in oil and gas demand as economies transition to net-zero emissions, and China’s consumption of oil likely peaked in 2024. Resources should be prioritized for decarbonization initiatives and the development of clean energy technologies to build long-term economic resilience and adaptability.
Conclusion
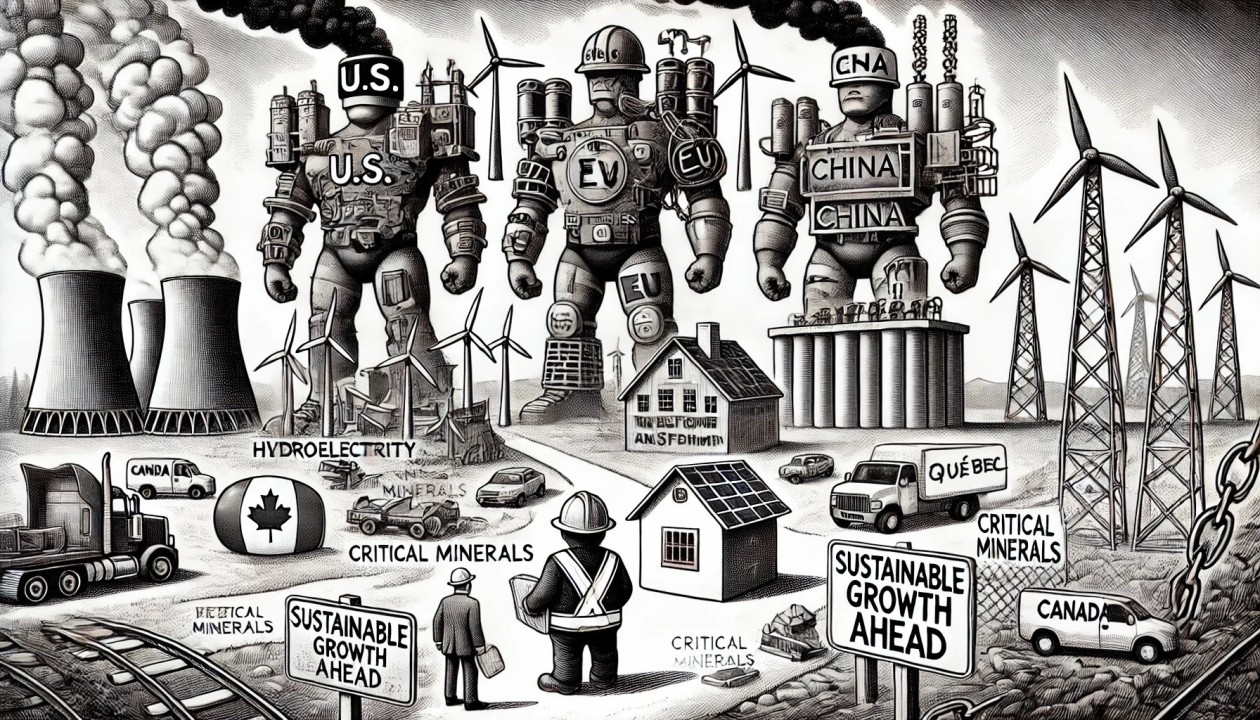
The challenges posed by the “America First” trade policy highlight the importance of strategic focus for Canada’s energy transition. By investing in resilient supply chains, emphasizing local energy use, and targeting key sectors where Canada has competitive advantages—such as hydroelectricity, critical minerals, and renewable hydrogen—Canada and Québec can strengthen their energy sectors, enhance economic resilience, and accelerate the transition to a sustainable energy future.
La politique «?America First?» et les décrets signés récemment par le président Trump posent des défis importants au secteur énergétique du Canada, particulièrement au Québec. Ces mesures incluent des tarifs proposés sur les biens canadiens, une divergence dans les politiques climatiques et un recul des incitatifs pour les véhicules électriques (VE) aux États-Unis. Compte tenu de l’intégration profonde des secteurs nord-américains de l’automobile et de l’énergie, ces développements ont des implications importantes pour la transition énergétique du Canada.
Les États-Unis ont proposé un tarif de 25 % sur les biens canadiens, y compris les exportations d’énergie, comme le pétrole, le gaz naturel et l’hydroélectricité. Le secteur hydroélectrique du Québec, qui dépend fortement des exportations d’électricité vers les États-Unis, serait directement touché. De tels tarifs affaibliraient la compétitivité d’Hydro Québec pour les contrats à long terme et sa capacité à échanger sur les marchés spot à court terme dans le nord-est des États-Unis. Le pétrole canadien, qui se négocie déjà à prix réduit, subirait une pression supplémentaire sur les prix, aggravant les défis financiers des provinces productrices de pétrole. Cette situation soulève aussi des questions sur la viabilité de l’oléoduc Keystone XL, promu par le président Trump, mais qui pourrait devenir inutile si les tarifs réduisent davantage la compétitivité du pétrole canadien. Cette contradiction ajoute à l’incertitude des futurs investissements énergétiques.
2. Réduction de la disponibilité des VE
Le recul des incitatifs et des programmes d’infrastructure pour les VE aux États-Unis pourrait freiner la croissance de la chaîne d’approvisionnement des VE au Canada. L’intégration du secteur automobile nord-américain signifie que les politiques américaines influencent directement les marchés canadiens. Une diminution de la disponibilité des VE aux États-Unis pourrait également limiter leur disponibilité au Canada, freinant l’adoption des technologies de transport propre et retardant les progrès vers les objectifs nationaux de réduction des émissions.
3. Restrictions commerciales et risques pour les chaînes d’approvisionnement
Les restrictions commerciales potentielles des États-Unis sur les importations de pays comme la Chine ou les contrôles à l’exportation sur les technologies critiques pourraient retarder la transition énergétique du Canada. Les technologies clés en danger incluent :
Intelligence artificielle (IA) : Essentielle pour optimiser les systèmes énergétiques, permettre des réseaux intelligents et améliorer l’efficacité énergétique dans tous les secteurs.
Systèmes de stockage d’énergie : Les batteries sont indispensables pour l’intégration des énergies renouvelables, garantissant la stabilité du réseau et équilibrant l’offre et la demande. Les systèmes avancés, tels que les batteries au lithium-ion et à l’état solide, jouent un rôle crucial dans l’adoption des énergies renouvelables et des véhicules électriques.
Logiciels de gestion des réseaux : Nécessaires pour moderniser les infrastructures énergétiques.
Composants solaires et éoliens : Turbines, panneaux et systèmes connexes.
Équipements de transmission et de distribution : Essentiels pour la transmission efficace de l’électricité et la fiabilité du réseau, en particulier avec l’intégration des énergies renouvelables. Les transformateurs sont actuellement en pénurie, tandis que les systèmes de transmission en courant continu (HVDC) représentent un marché en expansion.
Si le Canada suit les restrictions américaines, il pourrait faire face à des coûts plus élevés et à un accès limité à ces technologies critiques.
Réponses stratégiques
Renforcer les chaînes d’approvisionnement nationales
Le Canada dispose d’une économie bien plus petite que celles des États-Unis, de l’UE ou de la Chine. Il ne peut pas raisonnablement construire des chaînes d’approvisionnement pour tous les composants du secteur énergétique. Les gouvernements doivent se concentrer sur les segments critiques ou les domaines où le Canada a un avantage concurrentiel. Les stratégies clés incluent :
Relocalisation de la fabrication : Établir une production nationale pour des segments tels que les batteries pour VE, les composants d’éoliennes et les transformateurs afin de réduire la dépendance aux importations étrangères.
Diversification commerciale : Élargir les partenariats avec l’Europe, la Corée du Sud et le Japon pour sécuriser l’accès aux matériaux et technologies essentiels.
Accès aux matériaux critiques : Investir dans l’exploitation minière nationale et le recyclage des terres rares et d’autres matériaux vitaux.
Partenariats public-privé : Soutenir l’innovation et la fabrication locale grâce à des subventions et des investissements ciblés.
Exemples de domaines prioritaires :
Minéraux critiques : Tirer parti des abondantes réserves de lithium, de nickel et de cobalt du Canada pour soutenir la fabrication de batteries.
Hydroélectricité et stockage d’énergie : Capitaliser sur la capacité hydroélectrique du Québec, avec intégration est-ouest, et intégrer des systèmes de stockage d’énergie avancés.
Production d’hydrogène renouvelable : Utiliser les énergies renouvelables pour produire de l’hydrogène vert destiné à la décarbonisation industrielle, en particulier dans des secteurs comme l’acier et la chimie.
Prioriser l’utilisation locale de l’énergie
Les abondantes ressources hydroélectriques du Québec offrent une opportunité de se concentrer sur la décarbonisation locale plutôt que sur les exportations. L’électrification des transports, du chauffage et des industries lourdes au Québec pourrait réduire les émissions tout en isolant la province des marchés d’exportation volatils.
De même, bien que les secteurs pétroliers et gaziers du Canada méritent un soutien à court terme, les gouvernements doivent équilibrer les investissements face aux tendances à long terme. L’Agence internationale de l’énergie (AIE) prévoit un déclin mondial de la demande de pétrole et de gaz à mesure que les économies passent à des émissions nettes nulles, et la consommation de pétrole de la Chine a probablement atteint son pic en 2024. Les ressources devraient être priorisées pour les initiatives de décarbonisation et le développement de technologies d’énergie propre afin de renforcer la résilience économique et l’adaptabilité à long terme.
Conclusion
Les défis posés par la politique «?America First?» soulignent l’importance d’une approche stratégique pour la transition énergétique du Canada. En misant sur des chaînes d’approvisionnement robustes, en favorisant une utilisation accrue de l’énergie produite localement et en se concentrant sur des secteurs clés où le Canada détient un avantage compétitif, comme l’hydroélectricité, les minéraux critiques et l’hydrogène vert, le Canada et le Québec peuvent renforcer leur secteur énergétique, améliorer leur résilience économique et accélérer la transition vers un avenir énergétique respectueux de l’environnement.
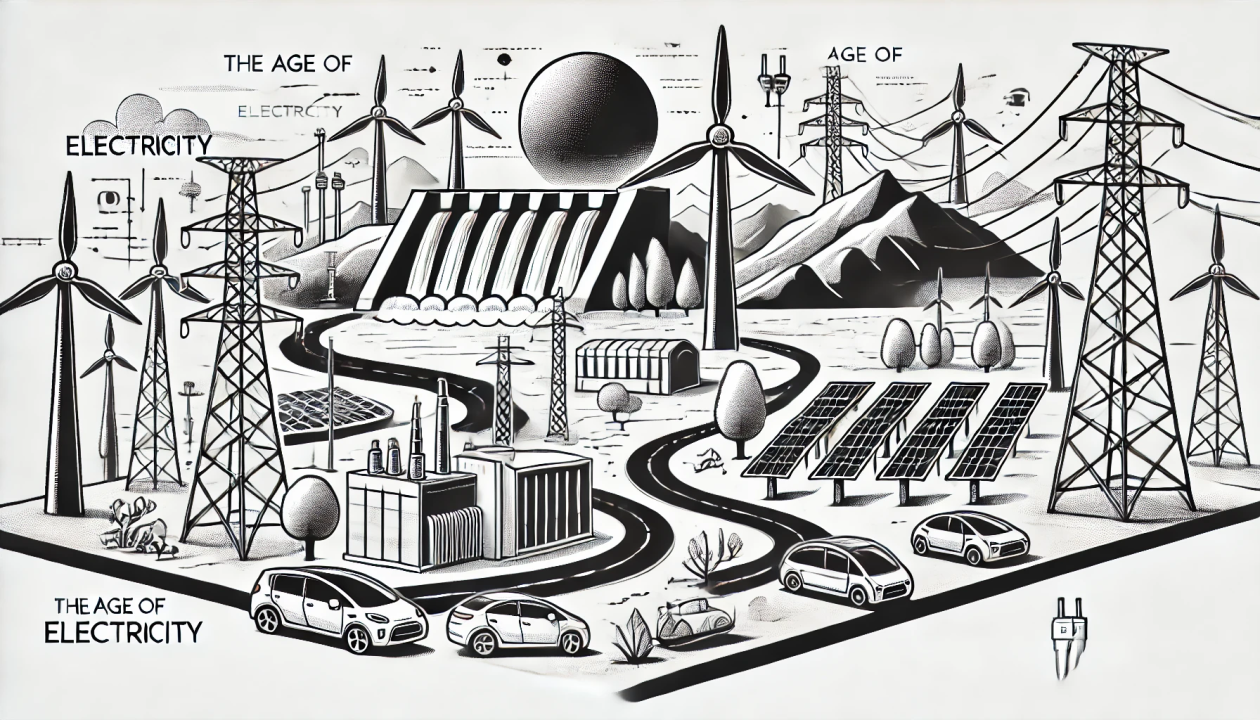
The world stands at the threshold of an electrified revolution. The Age of Electricity has arrived, promising to redefine industries, economies, and everyday life. By examining the evolution of electricity demand in the West and China, with a special focus on Canada and Québec, we uncover the key challenges and transformative opportunities that lie ahead.
The Dynamics of Electricity Demand: West vs. China
In the West, electricity demand grew steadily at an annual rate of approximately 2% from 1990 to the mid-2000s. However, this growth plateaued for nearly two decades, influenced by increased energy efficiency measures and the effects of deindustrialization. Today, we are witnessing a resurgence. Forecasts suggest that electricity consumption could increase by a factor of two, three, or even more by 2050, representing an annual growth rate of 2% to 5%.
China, on the other hand, tells a very different story. Starting from a lower baseline, the country’s electricity demand surged during the early 2000s, with annual growth rates reaching an impressive 11%. Although this rapid expansion has since moderated to around 5 or 6% per year, China remains a leader in electrification. This divergence highlights the West’s emphasis on energy efficiency and China’s accelerated industrialization trajectory.
The Rise of Electrification
Globally, the share of electricity in final energy consumption has increased significantly, rising from approximately 14% to 20% over the years. Québec presents an even more striking example of progress. With its abundant hydroelectric resources and Hydro Québec’s pioneering efforts, electricity now constitutes nearly half of the province’s energy consumption. In contrast, the West has generally stagnated at around 20%, while China has surged ahead, now achieving a 30% share.
These figures highlight an urgent reality: the West lags behind in the global electrification transition. As we advance further into this electrified era, addressing this disparity is crucial for future growth and sustainability. From a geopolitical perspective, this also puts China in a leading position for the developing world.
Why Electricity Is the Future
The era of electricity isn’t merely an option; rather, it’s an unavoidable reality. Decades of advancements in energy efficiency have positioned electricity as an increasingly competitive alternative to fossil fuels. Heat pumps, for example, can generate up to 3 kWh of heat for every 1 kWh of electricity consumed. Even when electricity is derived from a combined-cycle gas turbine, the total energy usage is lower compared to heating directly with natural gas. Similar efficiencies are evident in electric vehicles and induction stoves. Additionally, air conditioning—a growing necessity in many parts of the world—relies exclusively on electricity, as does much of the light industry, which continues to shift towards electric power.
As demand accelerates, the electricity sector is poised for transformative growth. Renewable energy sources like wind and solar, complemented by battery storage systems, are driving significant innovation while often being the most cost-effective options for new energy generation. Solar panels and batteries, increasingly installed at customer sites, also boost decentralized energy access. Despite the transition, traditional fossil fuel and nuclear plants will remain crucial in ensuring a stable energy supply.
Lessons From China and Challenges for the West
China’s strategic foresight in building a robust electricity supply chain over the past two decades offers a valuable roadmap for the West. The country has established itself as a leader not only in manufacturing solar panels, wind turbines, and batteries but also in producing critical components, such as transformers, switches, and advanced systems for direct current (DC) transmission lines. While Canada’s Hydro-Québec was a trailblazer in pioneering 735 kV alternating current (AC) transmission lines in the 20th century, China has surpassed this achievement with its 1,100 kV DC transmission lines, demonstrating superior technological advancements.
For the West, transitioning abruptly from decades of stagnant electricity demand to a phase of rapid growth presents unique challenges. Years of underinvestment, combined with stringent regulatory frameworks, have left utilities and infrastructure owners struggling to scale up. Rebuilding domestic manufacturing capacity, streamlining permitting processes, and fostering innovation will be pivotal to advancing the next phase of growth.
Building for the Future
To thrive in the Age of Electricity, bold, forward-thinking policies and industrial strategies are imperative. Governments must prioritize investments in grid modernization, renewable energy, and the development of domestic manufacturing capabilities. Utilities, in turn, should adopt innovative solutions to accelerate the deployment of critical infrastructure. Regulatory frameworks must strike a careful balance between safeguarding environmental standards and addressing the urgent need to expand capacity.
Canada, and Québec in particular, are uniquely positioned to lead this transition. By capitalizing on their hydroelectric expertise and committing to investments in emerging technologies, they can establish a global benchmark for sustainable and efficient energy systems. In particular, Quebec’s electricity supply chain is relatively large because it must support a significant portion of the final energy consumption in the province.
Conclusion
The Age of Electricity is not a distant aspiration; it is unfolding in real time. As electricity demand continues to surge, driven by decarbonization efforts and technological innovation, the West must take decisive action to bridge the gap. By drawing lessons from China’s proactive approach and leveraging local strengths, we can overcome the challenges ahead and unlock the immense potential of a fully electrified future.
Le monde se trouve au seuil d’une révolution électrique. L’ère de l’électricité est arrivée et elle promet de bouleverser les industries, les économies et notre mode de vie. Une analyse approfondie de l’évolution de la demande d’électricité en Occident et en Chine — avec un accent particulier sur le Canada et le Québec — offre des perspectives précieuses sur les défis et les opportunités de cette transformation.
Les dynamiques de la demande d’électricité : Occident vs Chine
En Occident, la demande d’électricité a augmenté à un taux annuel d’environ 2 % de 1990 au milieu des années 2000. Cependant, cette croissance s’est stabilisée pendant près de deux décennies en raison de l’amélioration de l’efficacité énergétique et de la désindustrialisation. Aujourd’hui, nous assistons à une reprise. Les tendances récentes indiquent que la demande en électricité pourrait être multipliée par deux, trois ou même par quatre d’ici 2050, correspondant à un taux de croissance annuel de 2 % à 5 %.
La Chine, en revanche, présente une dynamique bien différente. Partant d’une base plus basse, la demande d’électricité du pays a connu une croissance explosive au début des années 2000, avec des taux annuels atteignant environ 11 %. Bien que ce rythme ait depuis ralenti à environ 5-6 % par an, la Chine reste en avance sur l’Occident en termes d’électrification. Cette divergence reflète l’accent mis par l’Occident sur l’efficacité énergétique et l’industrialisation rapide de la Chine. Sur le plan géopolitique, cela positionne également la Chine comme un acteur majeur dans le soutien à la croissance des pays en développement.
L’essor de l’électrification
Au niveau mondial, la part de l’électricité dans la consommation énergétique finale est passée d’environ 14 % à 20 % au fil des ans. Au Québec, l’histoire est encore plus impressionnante. Grâce à des ressources hydroélectriques abondantes et au leadership d’Hydro Québec, l’électricité représente près de la moitié de la consommation énergétique de la province. En revanche, dans l’ensemble, l’Occident s’est stagné autour de 20 %, tandis que la Chine a progressé à 30 %.
Ces chiffres soulignent un point critique : dans l’ensemble, l’Occident accuse un retard dans la transition vers l’électrification. Alors que nous avançons dans cette nouvelle ère, cet écart doit être comblé.
Pourquoi l’électricité est l’avenir
L’ère de l’électricité n’est pas seulement un choix?; c’est une évolution inévitable. Des décennies de progrès dans l’efficacité énergétique ont rendu l’électricité non seulement plus viable, mais souvent plus économique que les combustibles fossiles. Prenons l’exemple des pompes à chaleur : elles peuvent générer jusqu’à 3 kWh de chaleur pour chaque kWh d’électricité utilisé. Même lorsque l’électricité provient de turbines à gaz à cycle combiné, la consommation d’énergie totale reste inférieure à celle du gaz naturel utilisé directement pour le chauffage. Des principes similaires s’appliquent aux véhicules électriques et aux cuisinières à induction. De plus, la climatisation, un besoin croissant dans de nombreuses régions, fonctionne exclusivement à l’électricité, tout comme une grande partie de l’industrie légère qui migre de plus en plus vers l’énergie électrique.
Avec l’accélération de la demande, une expansion transformatrice de la production d’électricité est inévitable. Les sources d’énergie renouvelable, telles que l’éolien et le solaire, associées aux systèmes de stockage par batteries, mènent des avancées significatives dans le secteur énergétique. Ces solutions sont fréquemment les options les plus rentables pour la production d’énergie nouvelle. En parallèle, les panneaux solaires et les batteries, souvent installés sur site, renforcent l’accès décentralisé à l’énergie. Cependant, dans cette phase de transition, les centrales fonctionnant aux combustibles fossiles et au nucléaire continueront de jouer un rôle essentiel pour assurer une fourniture énergétique fiable.
Leçons de la Chine et enjeux pour l’Occident
La prévoyance de la Chine dans la construction de sa chaîne d’approvisionnement en électricité au cours des deux dernières décennies offre une feuille de route pour l’Occident. Le pays s’est imposé comme un leader non seulement dans la fabrication de panneaux solaires, d’éoliennes et de batteries, mais aussi dans la production de composants essentiels, tels que les transformateurs, les interrupteurs et les systèmes avancés pour les lignes de transmission à courant continu. Au 20e siècle, l’entreprise publique canadienne Hydro-Québec a révolutionné les lignes de transmission en courant alternatif à 735 kV. Cependant, la Chine a depuis dépassé ce jalon en construisant des lignes à courant continu à 1?100 kV.
Pour l’Occident, le passage brutal d’une demande électrique stagnante à une phase de croissance rapide pose des défis uniques. Des années de sous-investissement et des cadres réglementaires stricts ont laissé les services publics et les propriétaires d’infrastructures en difficulté pour se développer. Reconstruire la capacité de fabrication et rationaliser les politiques sera essentiel pour favoriser la prochaine phase de croissance.
Construire l’avenir
Pour prospérer dans l’ère de l’électricité, nous avons besoin de politiques et de stratégies industrielles audacieuses et tournées vers l’avenir. Les gouvernements doivent donner la priorité aux investissements dans la modernisation des réseaux, les énergies renouvelables et les capacités de fabrication domestiques. Les services publics doivent adopter des solutions innovantes pour accélérer le déploiement des infrastructures. Les cadres réglementaires doivent trouver un équilibre entre les considérations environnementales et l’urgence d’une mise à l’échelle.
Le Canada, et plus particulièrement le Québec, se trouve face à une occasion sans pareille de diriger cette mutation. En exploitant son savoir-faire en matière d’hydroélectricité et en investissant dans les nouvelles technologies, il peut servir d’exemple à suivre pour le reste du monde. En particulier, la chaîne d’approvisionnement de l’industrie de l’électricité québécoise est considérable en raison de sa responsabilité de fournir une part substantielle de la demande énergétique finale de la province.
L’ère de l’électricité n’est pas une réalité lointaine — il se déroule maintenant. Alors que la demande d’électricité continue d’augmenter, stimulée par la décarbonisation et les avancées technologiques, l’Occident doit agir de manière décisive pour rattraper son retard. En nous inspirant de l’approche chinoise et en nous appuyant sur les forces locales, nous pouvons relever les défis à venir et libérer tout le potentiel de cet avenir électrisé.
Les petits réacteurs nucléaires modulaires (PRM) sont souvent abordés aux côtés des systèmes d’énergies renouvelables, telles que les panneaux solaires, les éoliennes et les batteries, en tant que solutions potentielles pour la production d’énergie propre. Bien que les PRM puissent être prometteurs pour des applications de niche, telles que la fourniture d’énergie fiable dans des endroits éloignés ou des zones à potentiel renouvelable limité, ils font face à des défis importants pour concurrencer l’énergie solaire et éolienne pour la production d’électricité grand public en raison de plusieurs facteurs inhérents :
Absence de réduction des coûts de la technologie nucléaire. Au cours des 60 à 70 dernières années, les réacteurs nucléaires ont connu une réduction minimale des coûts et de très longs délais de construction, les tendances récentes suggérant même une augmentation des coûts malgré les progrès technologiques. Cette absence de progrès indique que l’énergie nucléaire pourrait ne pas subir de réductions de coûts substantielles dans un avenir prévisible.
Économies d’échelle. Les grands réacteurs nucléaires bénéficient d’économies d’échelle, car le coût des composants, comme les chaudières et les turbines à vapeur, diminue proportionnellement lorsqu’ils sont mis à l’échelle. Intentionnellement, les PRM ne profitent pas de ces avantages, ce qui entraîne des coûts plus élevés par kilowattheure par rapport à leurs homologues plus grands au même niveau d’apprentissage. Cependant, les PRM visent à compenser cet inconvénient précoce par une courbe d’apprentissage plus rapide et des délais de construction plus courts.
Courbe d’apprentissage retardée. En tant que nouvelle technologie, les PRM n’ont pas de courbe d’apprentissage établie. En revanche, les panneaux solaires ont un taux de réduction des coûts bien établi d’environ 30% par doublement de production, tandis que les éoliennes et les batteries présentent des courbes d’apprentissage entre 15% et 25%.
Complexité technologique. Les PRM sont des technologies complexes, similaires aux gros avions de ligne et aux chasseurs à réaction. Ces systèmes complexes ont généralement des réductions de coûts plus lentes par rapport aux technologies modulaires plus simples comme les panneaux solaires, les éoliennes et les batteries, qui peuvent être produites en série efficacement. L’apprentissage des PRM est également ralenti par les considérations de sûreté inhérentes à leur nature nucléaire.
Poussée du gouvernement face aux limites technologiques. Bien qu’un fort soutien du gouvernement puisse accélérer le déploiement, il ne peut pas modifier fondamentalement la trajectoire des coûts d’une technologie. La courbe d’apprentissage est intrinsèque à la nature d’une technologie, ce qui signifie que les PRM sont limités par leur nature complexe, les obstacles de fabrication et les exigences de sécurité.
Avantage des énergies renouvelables dans la production de masse. Les panneaux solaires et les batteries sont relativement simples à fabriquer et à déployer, ressemblant à des produits qui peuvent être « imprimés » et produits en série. Les éoliennes sont beaucoup plus simples que les PRM, ce qui permet de réduire rapidement les coûts et de les adopter à grande échelle. Cet écart entre les énergies renouvelables et les PRM continue de se creuser.
En résumé : Les PRM sont confrontés à des inconvénients structurels en termes de coût, d’évolutivité et de taux d’amélioration technologique par rapport aux panneaux solaires, aux éoliennes et aux batteries. Ces technologies sont déjà moins chères, plus évolutives et s’améliorent à un rythme beaucoup plus rapide. L’énergie nucléaire, y compris les PRM, peut avoir sa place dans des régions où les ressources solaires ou éoliennes sont limitées. Toutefois, les sources d’énergie renouvelables devraient être le choix privilégié dans la recherche d’une production d’énergie rentable et respectueuse de l’environnement.
Nuclear small modular reactors (SMRs) are often discussed alongside renewables, such as solar panels, wind turbines, and batteries, as potential solutions for clean energy generation. While SMRs may hold promise for niche applications, such as providing reliable power in remote locations or areas with limited renewable potential, they face significant challenges in competing with solar and wind for mainstream electricity generation due to several inherent factors:
Lack of Cost Reductions in Nuclear Technology. Over the last 60–70 years, nuclear reactors have experienced minimal cost reduction and very long lead times, with recent trends even suggesting increased costs despite technological advances. This lack of progress indicates that nuclear energy may not undergo substantial cost reductions in the foreseeable future.
Economies of Scale. Large nuclear reactors benefit from economies of scale, as the cost of components like boilers and steam turbines decreases proportionally when scaled up. In contrast, SMRs intentionally do not take advantage of these benefits, leading to higher costs per kilowatt hour compared to their larger counterparts at the same learning level. However, SMRs aim to compensate for this early disadvantage with a faster learning curve and shorter lead times.
Delayed Learning Curve. As a new technology, SMRs lack an established learning curve. In contrast, solar panels have a well-established cost-reduction rate of about 30% per doubling of production, while wind turbines and batteries exhibit learning curves between 15% and 25%.
Technological Complexity. SMRs are intricate technologies, similar to large airliners and fighter jets. These complex systems typically have slower cost reductions compared to simpler, modular technologies like solar panels, wind turbines and batteries, which can be efficiently mass-produced. SMRs learning is also slowed by the inherent safety considerations associated with their nuclear nature.
Government Push vs. Technological Limitations. While strong government backing can accelerate deployment, it cannot fundamentally alter the cost trajectory of a technology. The learning curve is intrinsic to the nature of a technology, meaning SMRs are constrained by their intricate nature, manufacturing hurdles, and safety requirements.
Renewables Advantage in Mass Production. Solar panels and batteries are relatively simple to manufacture and deploy, resembling products that can be “printed” and mass-produced. Wind turbines are far simpler than SMRs, which enables rapid cost reductions and widespread adoption. This gap between renewable energy and SMRs continues to widen.
In summary: SMRs face structural disadvantages in terms of cost, scalability and technological improvement rates compared to solar panels, wind turbines and batteries. These technologies are already cheaper, more scalable and improving at a much faster rate. Nuclear energy, including SMRs, may have a place in regions with limited solar or wind resources. However, renewable energy sources should be the preferred choice in the pursuit of cost-effective and environmentally friendly energy generation.
The report provides comprehensive guidelines for integrated resource planning (IRP) in the electricity sector. It serves as an excellent starting point for modernizing these processes, offering 50 best practices with concrete and applicable recommendations.
The report highlights the engagement of a diverse group of stakeholders, including regulators and consumer advocates, fostering transparency and inclusion. Additionally, its focus on scenario planning and adaptability is well-aligned with the evolving energy sector, characterized by the growth of renewables, electrification, and grid modernization.
Limitations and Concerns
The emphasis on scenario modeling and planning is considered excessive. While these tools are essential, the report does not address the risks of overcomplicating models or the challenges of translating results into concrete decisions. It also lacks guidance on the level of effort required or the timelines for preparing an IRP—an important omission as these processes become increasingly complex.
The report remains focused on electricity planning and does not adopt a broader integrated energy system planning (IESP) approach. However, electricity sector expansion must align with the transition away from fossil fuels. For example, implementing a district heating network involves coordinating the partial decommissioning of the gas grid, expanding the electrical system to power heat pumps, and establishing the heating network itself. The absence of this integrated approach complicates overall energy strategies.
Context and Key Insights
A map included in the report shows U.S. states adopting IRPs or similar processes. Notably, Texas, despite its rapid growth in renewable energy, does not require IRPs. The absence of an IRP may have played a role in the recent power outages. However, it is interesting to note that an IRP was not necessary to accelerate the deployment of renewables. This is a point worth considering.
Conclusion
Despite its strengths, the report would benefit from incorporating a broader energy perspective and clear guidance for practical implementation. A better consideration of interactions between energy sectors would enhance its utility in addressing the complex challenges of the energy industry.
Le rapport fournit des lignes directrices exhaustives pour la planification intégrée des ressources (PIR) dans le secteur de l’électricité. Il constitue un excellent point de départ pour moderniser ces processus, avec ses 50 pratiques exemplaires offrant des recommandations concrètes et applicables.
Le rapport met en avant la mobilisation d’un groupe diversifié d’intervenants, incluant régulateurs et défenseurs des droits des consommateurs, favorisant la transparence et l’inclusion. De plus, son accent sur la planification des scénarios et l’adaptabilité répond bien aux besoins d’un secteur énergétique en pleine évolution, marquée par l’expansion des énergies renouvelables, l’électrification et la modernisation des réseaux.
Limites et préoccupations
L’accent mis sur la modélisation et la planification des scénarios est jugé excessif. Bien que ces outils soient cruciaux, le rapport ne traite pas des risques liés à la complexification des modèles ni des difficultés à traduire les résultats en décisions concrètes. Il manque également de directives sur le niveau d’effort requis ou les échéanciers pour préparer un PIR, une lacune notable alors que ces processus deviennent de plus en plus complexes.
Le rapport reste axé sur la planification électrique et non sur une planification intégrée des ressources énergétiques (PGIRE). Or, l’expansion de l’électricité doit être alignée avec la transition des combustibles fossiles. Par exemple, la mise en œuvre d’un réseau de chauffage urbain nécessite une coordination entre le démantèlement partiel du réseau gazier, l’expansion du système électrique pour alimenter les pompes à chaleur, et l’établissement de ce réseau de chauffage. Ce manque d’intégration complique les stratégies globales.
Éléments contextuels et enseignements
Une carte incluse dans le rapport montre les États américains qui adoptent des PIR ou des processus similaires. Notamment, le Texas, malgré sa croissance rapide dans les énergies renouvelables, n’exige pas de PIR. L’absence d’un PIR a peut-être joué un rôle dans les récentes pannes de courant. Cependant, il est intéressant de noter qu’un PIR n’était pas nécessaire pour accélérer le déploiement des énergies renouvelables. C’est quelque chose à méditer.
Conclusion
Malgré ses qualités, le rapport gagnerait à intégrer une perspective énergétique plus large et des orientations claires pour l’application pratique. Une meilleure prise en compte des interactions entre secteurs énergétiques renforcerait son utilité face aux défis complexes du secteur de l’énergie.
La transition énergétique aux États-Unis est sur le point de connaître un changement majeur, avec Chris Wright , PDG de Liberty Energy et futur Secrétaire à l’énergie, et Elon Musk, PDG de Tesla et futur chef du Département de l’efficacité gouvernementale (DOGE). Leurs approches contrastées — le soutien assumé de Wright aux hydrocarbures et l’élan agressif de Musk pour les énergies renouvelables — mettent en lumière la complexité d’équilibrer le soutien politique, la sécurité énergétique, les objectifs climatiques et la croissance économique.
Chris Wright plaide pour une énergie abondante, abordable et fiable grâce au pétrole, au gaz et au nucléaire, en mettant l’accent sur des solutions comme la capture du carbone pour réduire les émissions. Il soutient l’expansion de la production nationale, la simplification des réglementations et l’utilisation de l’énergie américaine comme un outil géopolitique.
Elon Musk envisage une transition rapide vers les énergies renouvelables, l’électrification et le stockage à grande échelle, voyant la décarbonation comme une opportunité économique. Musk défend des politiques qui accélèrent l’innovation, augmentent la production de véhicules électriques et de batteries, et positionnent les États-Unis comme un leader dans les technologies propres, l’IA et l’exploration spatiale.
Implications pour la politique américaine
Tous deux seront probablement membres du nouveau Conseil national de l’énergie, dirigé par le futur secrétaire à l’intérieur Doug Burgum et visant à établir la « domination énergétique » américaine. Leur influence combinée pourrait aboutir à une approche “tout-à-la-fois” :
Changement climatique : Des politiques équilibrant l’accent de Wright sur la sécurité énergétique et le gradualisme avec l’urgence de Musk pour les VE et les énergies renouvelables.
Production d’énergie : Expansion de la production de pétrole et de gaz naturel (et peut-être du nucléaire), en parallèle à des investissements dans les énergies renouvelables et le stockage.
Réglementations : Une déréglementation générale, favorisée par Wright et Musk, simplifiant le développement énergétique tout en réduisant potentiellement les incitations à l’adoption des énergies propres.
Compétitivité : Exploitation des ressources énergétiques et du leadership technologique des États-Unis, notamment dans les centres de données IA.
Industrie manufacturière : Renégociation des accords commerciaux (par exemple, l’ACEUM), imposition de tarifs pour protéger les industries nationales et réduction des charges réglementaires sur les fabricants.
Relations Internationales : Combinaison de l’indépendance énergétique avec un leadership mondial dans le secteur de l’énergie.
Points de conflit entre Wright et Musk
Combustibles Fossiles : Le soutien solide de Wright aux hydrocarbures comme élément essentiel de la sécurité énergétique contraste fortement avec la mission de Musk de les éliminer au profit des énergies renouvelables.
Rythme de transition : L’urgence de Musk pour accélérer la transition vers les énergies renouvelables pourrait entrer en conflit avec l’approche plus progressive de Wright, priorisant la fiabilité et la préparation des infrastructures.
Impact sur le commerce du Canada
Pétrole et gaz : L’accent mis par Wright sur la production nationale pourrait réduire la dépendance des États-Unis au pétrole canadien, bien que la dépendance des raffineries américaines au traitement du brut canadien lourd limite ce changement à court terme.
Électricité : L’augmentation de l’utilisation du gaz naturel et des batteries à grande échelle aux États-Unis pourrait concurrencer l’hydroélectricité canadienne (y compris Hydro Québec), mais la croissance de l’adoption des VE, des centres de données et du secteur manufacturier pourrait stimuler la demande d’électricité encore plus rapidement.
Industrie manufacturière : La faible productivité et innovation du secteur manufacturier canadien risque de le marginaliser dans les secteurs émergents des technologies propres comme les énergies renouvelables, l’équipement électrique, les VE et les batteries.
Considérations stratégiques pour le Canada
Pour rester compétitif, le Canada doit :
Diversifier les exportations de pétrole et de gaz pour réduire la dépendance aux États-Unis.
S’engager dans la planification interrégionale des réseaux électriques, avec les États américains, en verrouillant ainsi la production canadienne.
Combler les lacunes en matière de productivité et d’innovation dans le secteur manufacturier.
Conclusion
Le leadership de Wright et Musk redéfinira la politique énergétique des États-Unis, visant à établir une « domination énergétique » américaine. Pour le Canada, cela implique d’ajuster ses stratégies pour rester compétitif tout en s’alignant sur les priorités évolutives des États-Unis.
The U.S. energy transition is poised for a major shift, led by Chris Wright , CEO of Liberty Energy and future Secretary of Energy, and Elon Musk, CEO of Tesla and incoming head of the Department of Government Efficiency (DOGE). Their contrasting approaches—Wright’s assumed support for hydrocarbons and Musk’s aggressive push for renewables—highlight the complexity of balancing political support, energy security, climate goals, and economic growth.
Chris Wright advocates for abundant, affordable, reliable energy through oil, gas, and nuclear power, focusing on solutions like carbon capture to reduce emissions. He supports expanded domestic production, streamlined regulations, and using U.S. energy as a geopolitical tool.
Elon Musk envisions a rapid shift to renewables, electrification, and grid-scale storage, seeing decarbonization as an economic opportunity. Musk champions policies that accelerate innovation, scale EV and battery production, and positions the U.S. as a leader in clean technologies, AI, and space exploration.
Implications for U.S. Policy
Both are likely to become members of the new National Energy Council, headed by upcoming interior secretary Doug Burgum and which aims to establish American “energy dominance”. Their combined influence will likely result in an “all-of-the-above” approach:
Climate Change: Policies balancing Wright’s emphasis on energy security and gradualism with Musk’s urgency for EVs and renewables.
Energy Production: Expanded oil and natural gas production (and maybe nuclear power) alongside investments in renewables and storage.
Regulations: Broad deregulation favoured by both Wright and Musk streamlining energy development, but potentially cutting incentives for clean energy adoption.
Competitiveness: Leveraging the U.S.’s energy resources and tech leadership, especially in AI data centres.
Manufacturing: Renegotiating trade agreements (e.g. USMCA), imposing tariffs to protect domestic industries, and reducing regulatory burdens on manufacturers.
Foreign Relations: Blending energy independence with global energy leadership.
Areas of Conflict between Wright and Musk
Fossil Fuels: Wright’s strong support for hydrocarbons as essential to energy security stands in sharp contrast to Musk’s mission to phase them out in favour of renewables.
Pace of Transition: Musk’s urgency to accelerate the renewable transition could conflict with Wright’s call for a more gradual approach, prioritizing reliability and infrastructure readiness.
Impact on Canada’s Trade
Oil and Gas: Wright’s focus on domestic oil production could reduce U.S. reliance on Canadian oil, though U.S. refineries’ reliance on processing heavy Canadian crude limits this shift in the short term.
Electricity: Increased U.S. natural gas power and grid scale batteries could compete with Canadian hydropower (especially Hydro Québec), but growth in EV adoption, data centres and manufacturing could push electricity demand even faster.
Manufacturing: Due to its lack of productivity and innovation, Canada risks being left behind in the rapidly growing clean technology sectors, such as renewable energy, electric machinery, electric vehicles, and battery production.
Strategic Considerations for Canada
To remain competitive, Canada must:
Diversify oil and gas exports to reduce dependence on the U.S.
Engage in interregional grid planning, with US states locking in Canadian generation.
Address productivity and innovation gaps in manufacturing.
Conclusion
Wright and Musk’s leadership will redefine U.S. energy policy, striving to establish American “energy dominance”. For Canada, this means adjusting strategies to remain competitive while aligning with evolving U.S. priorities.
What are your thoughts—how can Canada thrive in this evolving energy landscape??
Les premiers microprocesseurs apparus dans les années 1970 ont déclenché une cascade de révolutions technologiques dans les domaines de l’informatique, des télécommunications, d’Internet et des réseaux sociaux. La prochaine vague pourrait être l’IA. J’ai de l’expérience dans toutes les vagues précédentes, du codage de base à la gestion de services de télécommunications concurrentiels, en passant par l’exploitation d’un service téléphonique Internet et l’analyse de diverses entreprises de médias. (Et mon fils est en IA.)
Je suis passé à l’énergie il y a plus de 20 ans, lorsque j’ai vu l’éminente transformation de ce secteur.
Aujourd’hui, je constate des vagues similaires dans la transition vers l’abandon des combustibles fossiles : les énergies renouvelables, le transport, le chauffage et l’hydrogène. Toutefois, il existe également des différences importantes entre cette révolution énergétique et celle qui a touché l’industrie informatique.
Dans les deux révolutions, chaque vague a renforcé la précédente. Il est cependant difficile de prédire quand une nouvelle vague surviendra ni sous quelle forme. Les fournisseurs traditionnels ont souvent du mal à adopter et à s’adapter aux nouvelles technologies et aux nouveaux modèles d’affaires, ce qui finit par éroder leur valeur. L’écosystème devient plus grand et plus complexe, créant ainsi des opportunités pour de nouveaux acteurs d’émerger et de prospérer. Les deux révolutions ont des répercussions sur la géopolitique. Par exemple, au cours des années 1990, les pays en développement ont vu diminuer leurs recettes internationales provenant des télécommunications, tandis que certains pays verront leurs recettes tirées des énergies fossiles baisser dans un avenir rapproché. Même si les services publics, comme les télécommunications, le câble et l’électricité, survivent à la tourmente, ils sont cantonnés dans leur rôle d’opérateurs, ne pouvant pas se développer dans la chaîne de valeur. En revanche, les services publics de gaz peuvent connaître une contraction.
Toutefois, la transition énergétique surpasse la révolution numérique en termes d’impact économique. Elle ne se limite pas à avoir un impact économique, elle est aussi physique grâce à des projets d’infrastructure colossaux. De plus, elle se distingue par le fait que, même si les progrès technologiques ont déclenché l’ère de l’informatique, les préoccupations environnementales constituent le moteur du changement actuel. Par conséquent, les politiques gouvernementales (et certains diront même l’ingérence) jouent un rôle plus important dans la transition énergétique.
Comme la consommation d’énergie des centres de données augmente rapidement, il est possible que la transition énergétique et la transformation numérique en cours convergent. Espérons que ces changements ne se transforment pas en tsunami.
The first microchips in the 1970s sparked a series of transformation waves in computing, telecommunications, Internet and social media. The next wave could be AI. I have experience in all the previous waves, from basic coding to managing competitive telecom services, operating an internet telephone service, and analyzing various media companies. (And my son is in AI.)
I switched to energy over 20 years ago, as I saw the eminent transformation of this sector.
I observe similar waves in the transition away from fossil fuels: renewables, transportation, heating, and hydrogen. However, there are also notable distinctions between the energy transition and the one experienced by the computer industry.
In both revolutions, successive waves superimposed and amplified their predecessors. Yet, predicting when the next wave will emerge, or what shape it may take, remains elusive. Traditional suppliers often struggle to adopt and adapt to new technologies and business models, ultimately eroding their value. The ecosystem becomes larger and more complex, creating opportunities for new players to emerge and thrive. Both revolutions have geopolitical impacts. For instance, the 1990s saw a reduction in international telecom revenues for developing countries, while some countries will see reduced fossil fuel revenues in the coming years. Public utilities, such as telecom, cable, and electricity, survive the turmoil, but remain limited to being mere carriers, unable to expand up or down the value chain. Gas utilities, on the other hand, may experience contraction.
However, the energy transition dwarfs the digital revolution. It impacts economies not only numerically but physically, with massive infrastructure projects. What also sets it apart is that while technological advances sparked the computer age, environmental concerns drive the current shift. Therefore, government policies (and some may say meddling) are more important in the energy transition.
As data centre energy consumption rises rapidly, there is a possibility that the ongoing energy transition and digital transformation will converge. Let’s hope these changes don’t turn into a tsunami.
Les gouvernements d’Amérique du Nord et d’Europe ont mis en place plusieurs politiques pour favoriser la production d’hydrogène à bas carbone (vert ou bleu, pour les gens qui aiment les couleurs), mais peu de politiques pour forcer son utilisation.
Actuellement, l’hydrogène de source fossile est surtout utilisé en raffinage, pour la fabrication de fertilisant et pour la fabrication de méthanol. Cet hydrogène est souvent auto-produit sur place à partir de gaz naturel. Ces usages particuliers sont fortement exposés aux marchés et très sensibles aux prix. On comprend qu’il y a alors peu d’intérêt pour la même molécule, mais qui coûte plus cher à produire juste parce qu’on émet moins de carbone.
L’industrie de l’hydrogène à bas carbone c’est alors tournée vers des usages émergents, comme la réduction du minerai de fer ou le transport lourd. Or, il y a encore peu de demande pour ces usages, et il n’est même pas certain qu’une demande importante émerge en transport. En conséquence, on voit des projets de production d’hydrogène à bas carbone être stoppés aux É.-U. et au Canada, ainsi que des projets de pipeline s’arrêter en Allemagne, simplement parce qu’il n’y a pas de preneurs.
À court terme, je pense qu’on doit considérer l’hydrogène à bas carbone comme un produit de première qualité, dont la quantité est limitée et donc le vendre pour des usages moins exposés aux marchés, comme certains usages industriels où de l’hydrogène très pur est requis, par exemple en fabrication microélectronique. En fait, pour certains usages industriels, l’hydrogène vert pourrait même être concurrentiel si fabriqué près de là où il est utilisé, évitant le transport d’hydrogène fossile fabriqué dans les usines pétrochimiques.