Que peuvent apprendre le Canada et le Québec de l’histoire pour stimuler l’innovation énergétique aujourd’hui??
(LinkedIn : https://www.linkedin.com/pulse/linnovation-en-france-napoléonienne-et-industrielle-leçons-marcoux-ojdue/)
La France napoléonienne a mis l’accent sur les progrès scientifiques centralisés, tandis que la Grande-Bretagne industrielle a prospéré grâce à l’expérimentation axée sur le marché et à la collaboration avec le secteur privé. Résultat?? La Grande-Bretagne a rapidement adopté des innovations comme la machine à vapeur, tandis que la France, malgré des avancées, a eu du mal avec la mise à l’échelle et la commercialisation.
Aujourd’hui, le Canada est à un carrefour similaire. Alors que les initiatives étatiques en matière d’énergie propre ont permis des progrès remarquables, garantir que ces innovations passent des laboratoires de recherche à une adoption à grande échelle reste un défi.
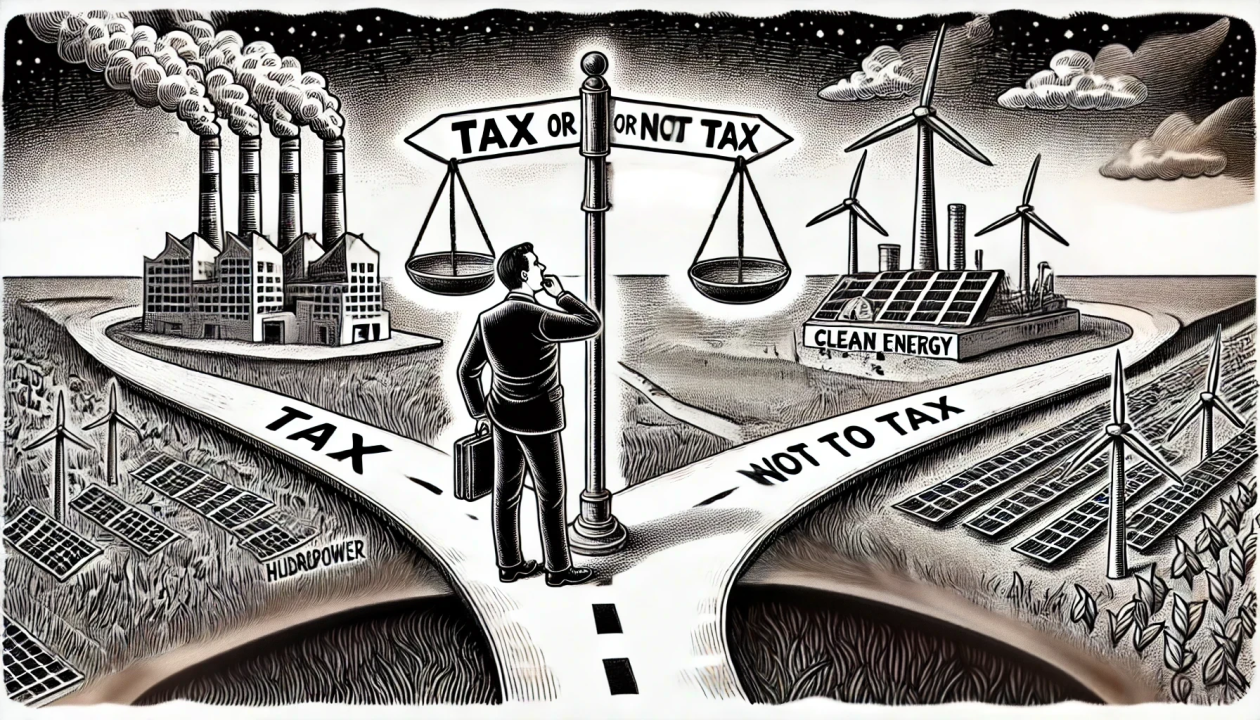
?? Le Canada devrait-il se concentrer davantage sur les incitations au secteur privé pour accélérer la commercialisation?? ?? Quelles leçons de l’histoire peuvent aider à équilibrer la recherche dirigée par le gouvernement et l’agilité entrepreneuriale??
Les réponses résident dans un mélange stratégique de leçons historiques, de politiques modernes et d’actions audacieuses. Découvrez comment le Canada et le Québec peuvent bâtir un écosystème énergétique qui favorise l’innovation et renforce la sécurité énergétique nationale.
I. Comparaison des deux modèles d’innovation énergétique
Bien que la France napoléonienne et la Grande-Bretagne de la révolution industrielle aient toutes deux joué un rôle crucial dans l’innovation énergétique, leurs approches différaient considérablement. Le modèle dirigé par l’État en France était axé sur des avancées scientifiques contrôlées, tandis que l’approche décentralisée et axée sur le marché de la Grande-Bretagne encourageait une adoption rapide. Le tableau ci-dessous met en évidence les principales différences entre ces deux modèles :

Ce contraste montre que si la recherche dirigée par l’État peut générer des percées majeures, le progrès technologique durable repose souvent sur des réseaux d’innovation décentralisés, des investissements privés et des incitations axées sur le marché. En Grande-Bretagne, des organisations comme la Lunar Society (qui comprenait des inventeurs comme James Watt et Matthew Boulton) et la Royal Society ont offert des plateformes essentielles pour l’échange de connaissances et la collaboration. Ces réseaux informels ont permis aux inventeurs de perfectionner leurs idées et d’accélérer les applications pratiques, favorisant ainsi un écosystème d’innovation dynamique.
En revanche, la France s’appuyait sur des institutions formelles, comme l’Académie des Sciences et l’École Polytechnique, axées sur les progrès scientifiques dirigés par l’État. Bien que ces institutions aient garanti un haut niveau de connaissances théoriques et de recherche systématique, le contrôle centralisé limitait la commercialisation des innovations. Le Canada et le Québec doivent trouver un équilibre entre ces modèles pour développer efficacement les technologies d’énergie propre dans le contexte géopolitique actuel.
II. Invention vs adoption en énergie
Étude de cas : Innovation dans la vapeur
La France a contribué à la recherche fondamentale en innovation énergétique. Sadi Carnot (1824) a développé la théorie de la thermodynamique, posant ainsi les bases des moteurs thermiques modernes. Cependant, l’absence d’un écosystème industriel a empêché des applications pratiques immédiates.
Auparavant, la machine à vapeur de James Watt (1769) avait révolutionné l’industrie britannique, permettant la production de masse dans le textile, l’exploitation minière et les chemins de fer. Les réseaux d’investissement privés et l’extraction massive de charbon en Grande-Bretagne ont favorisé une adoption rapide. De plus, les inventeurs britanniques pratiquaient fréquemment l’expérimentation et les ajustements progressifs, souvent en produisant des prototypes sans base théorique approfondie. La Lunar Society a facilité les discussions permettant de combler l’écart entre la théorie scientifique et les applications industrielles.
Implications pour le Canada et le Québec
Le Québec, avec son secteur hydroélectrique dominant, reflète le modèle dirigé par l’État de la France, où les grands projets énergétiques sont sous contrôle gouvernemental. Pour les nouvelles technologies d’énergie propre (ex. hydrogène vert, stockage d’énergie), le Canada doit favoriser les investissements privés pour accélérer l’adoption au-delà des projets soutenus par l’État. Encourager des centres d’innovation expérimentale et des laboratoires publics où les entreprises peuvent tester et affiner des solutions énergétiques en phase initiale pourrait accélérer la commercialisation.
III. Défis d’adoption : comparaison entre la France, la Grande-Bretagne et le Canada/Québec
1. Le contrôle centralisé ralentit la commercialisation
La France napoléonienne a adopté une approche hautement structurée du progrès scientifique, ce qui a conduit à des avancées majeures, mais souvent limitées par un contrôle bureaucratique strict. Les scientifiques et ingénieurs travaillaient sous mandats gouvernementaux, et les incitations du secteur privé étaient limitées. Résultat : les avancées technologiques mettaient du temps à être appliquées industriellement.
En revanche, le modèle britannique axé sur le marché a favorisé une adoption industrielle rapide, soutenue par l’investissement privé et des protections de brevets solides. Les inventeurs avaient la liberté de développer, affiner et commercialiser leurs innovations, entraînant ainsi des progrès énergétiques rapides.
De la même manière, le Canada fait aujourd’hui face à un défi similaire, devant combler le fossé entre la recherche financée par l’État et l’adoption industrielle à grande échelle. Malgré des investissements publics en R&D ayant conduit à des avancées dans les énergies renouvelables, les barrières bureaucratiques, particulièrement interprovinciales, et les contraintes réglementaires ralentissent la commercialisation. Le Canada et le Québec doivent s’assurer que les innovations énergétiques propres ne stagnent pas dans les institutions de recherche, mais qu’elles soient intégrées dans l’ensemble du marché.
2. L’innovation énergétique nécessite une adoption industrielle
La France napoléonienne a produit de nombreuses découvertes scientifiques majeures, mais celles-ci sont souvent restées confinées à des applications académiques ou militaires au lieu d’être largement mises en œuvre dans l’économie.
Le modèle décentralisé et axé sur le secteur privé de la Grande-Bretagne a permis une adoption rapide des innovations, en particulier dans le domaine de l’énergie.
Aujourd’hui, le Canada est confronté à des défis similaires. Bien qu’il soit un pionnier en matière d’innovation énergétique (comme l’hydroélectricité, le captage du carbone et les batteries), l’adoption reste limitée en raison de contraintes réglementaires et d’un manque d’incitations pour le secteur privé.
Pour exploiter pleinement le potentiel des technologies propres, le Canada doit aligner les forces du marché sur les incitations à l’innovation, garantissant que les avancées scientifiques se transforment en applications industrielles et grand public.
Encourager l’adoption nationale des technologies propres réduira la dépendance aux marchés étrangers, rendant ainsi le Canada plus résilient face à l’instabilité géopolitique.
IV. Priorités stratégiques pour le Canada et le Québec en matière d’énergie
Les leçons des approches historiques de la France et de la Grande-Bretagne offrent des orientations précieuses pour l’avenir énergétique du Canada et du Québec. Une transition énergétique réussie nécessite un équilibre stratégique entre le soutien gouvernemental et les politiques industrielles et le dynamisme du secteur privé. Les politiques doivent encourager l’investissement, accélérer l’adoption du marché et garantir la souveraineté énergétique pour assurer une résilience à long terme.
1. Encourager l’investissement privé dans l’énergie propre — Les recherches financées par le gouvernement doivent être couplées à des partenariats industriels pour assurer une adoption à grande échelle. Le Canada doit donner la priorité à l’indépendance énergétique face à l’agression économique des États-Unis.
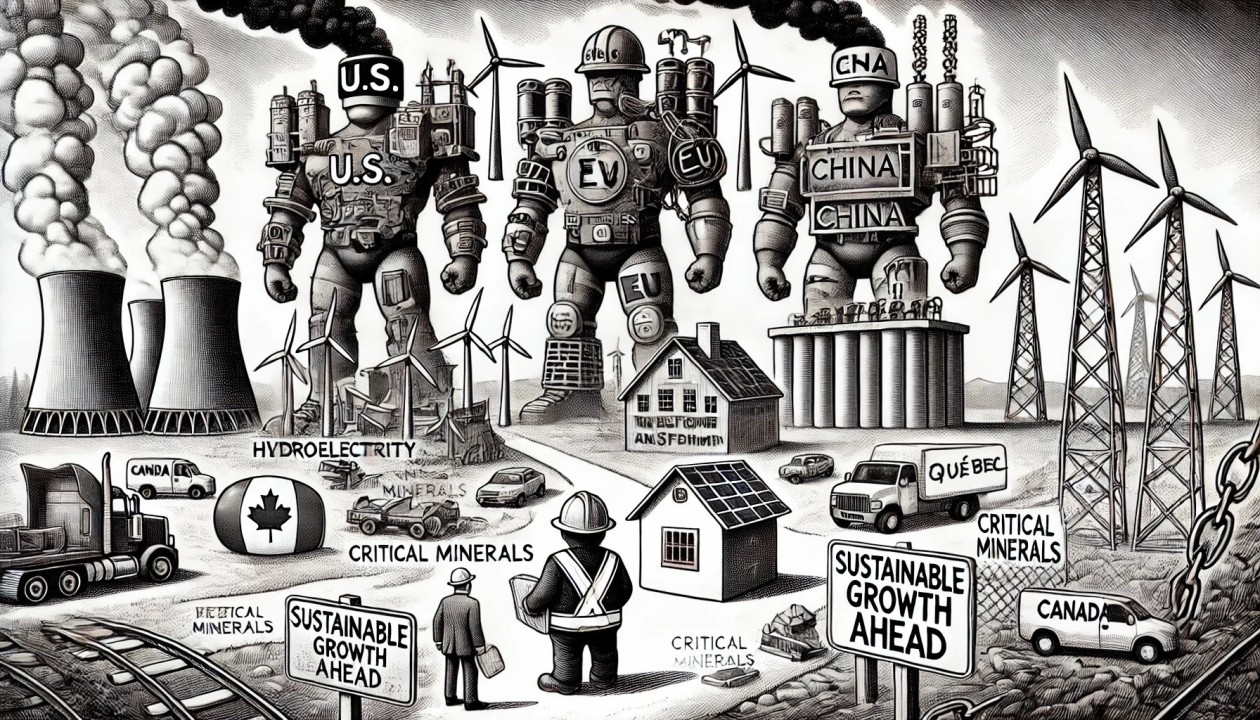
2. Assurer la résilience des chaînes d’approvisionnement énergétiques — Les tensions commerciales montrent l’importance de la production nationale d’équipements électriques, de batteries et de technologies énergétiques propres.
3. Des pôles d’innovation régionaux, mais une coordination pancanadienne — Le Canada et le Québec doivent renforcer les pôles régionaux d’innovation énergétique tout en assurant une coordination nationale. Bien que les pôles puissent être spécialisés, une stratégie globale est essentielle pour maximiser l’innovation, le partage des ressources et la sécurité énergétique.
4. Faire de la souveraineté énergétique une priorité nationale — Face aux menaces géopolitiques, le Canada doit protéger ses actifs énergétiques stratégiques et son infrastructure contre toute prise de contrôle étrangère.
Conclusion : Le chemin vers l’innovation énergétique du Canada
Le contraste entre les avancées scientifiques structurées de la France et l’expérimentation pragmatique de la Grande-Bretagne met en lumière des enseignements essentiels pour le Canada et le Québec aujourd’hui. En combinant une recherche soutenue par l’État avec une commercialisation dynamique portée par le secteur privé, le Canada peut bâtir un secteur de l’énergie propre solide et résilient, garantissant ainsi la stabilité économique et la sécurité énergétique à long terme.